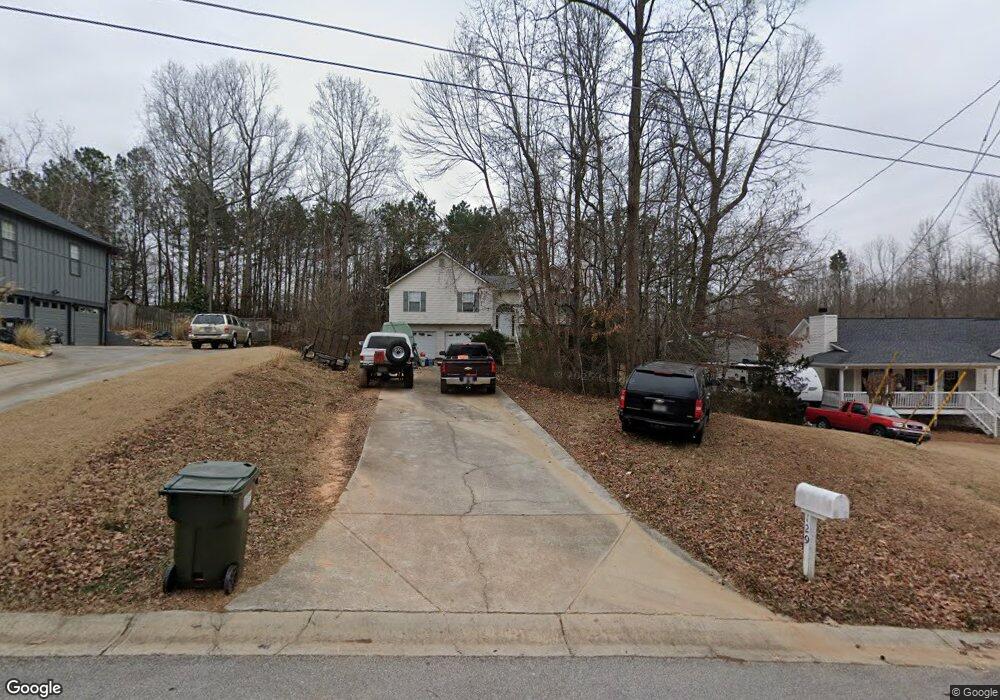
129 Summer Creek Cove Dallas, GA 30157
East Paulding County NeighborhoodEstimated Value: $321,918 - $344,000
3
Beds
2
Baths
1,375
Sq Ft
$243/Sq Ft
Est. Value
About This Home
This home is located at 129 Summer Creek Cove, Dallas, GA 30157 and is currently estimated at $333,730, approximately $242 per square foot. 129 Summer Creek Cove is a home located in Paulding County with nearby schools including Roland W. Russom Elementary School, East Paulding Middle School, and North Paulding High School.
Ownership History
Date
Name
Owned For
Owner Type
Purchase Details
Closed on
Sep 5, 2018
Sold by
Ec
Bought by
Tidal Wave Pools Llc
Current Estimated Value
Home Financials for this Owner
Home Financials are based on the most recent Mortgage that was taken out on this home.
Original Mortgage
$78,000
Outstanding Balance
$45,859
Interest Rate
4.5%
Mortgage Type
New Conventional
Estimated Equity
$287,871
Purchase Details
Closed on
Dec 28, 2016
Bought by
Suba Investments Llc
Purchase Details
Closed on
Aug 15, 2016
Sold by
Barbara Ann Estate
Bought by
Ec & Nm Llc
Create a Home Valuation Report for This Property
The Home Valuation Report is an in-depth analysis detailing your home's value as well as a comparison with similar homes in the area
Home Values in the Area
Average Home Value in this Area
Purchase History
| Date | Buyer | Sale Price | Title Company |
|---|---|---|---|
| Tidal Wave Pools Llc | $98,000 | -- | |
| Suba Investments Llc | $43,500 | -- | |
| Ec & Nm Llc | $87,000 | -- |
Source: Public Records
Mortgage History
| Date | Status | Borrower | Loan Amount |
|---|---|---|---|
| Open | Tidal Wave Pools Llc | $78,000 |
Source: Public Records
Tax History Compared to Growth
Tax History
| Year | Tax Paid | Tax Assessment Tax Assessment Total Assessment is a certain percentage of the fair market value that is determined by local assessors to be the total taxable value of land and additions on the property. | Land | Improvement |
|---|---|---|---|---|
| 2024 | $3,182 | $127,928 | $12,000 | $115,928 |
| 2023 | $3,070 | $117,772 | $12,000 | $105,772 |
| 2022 | $2,600 | $99,720 | $12,000 | $87,720 |
| 2021 | $2,272 | $78,200 | $10,000 | $68,200 |
| 2020 | $2,071 | $69,720 | $10,000 | $59,720 |
| 2019 | $1,181 | $67,760 | $10,000 | $57,760 |
| 2018 | $1,546 | $51,320 | $10,000 | $41,320 |
| 2017 | $1,063 | $53,120 | $10,000 | $43,120 |
| 2016 | $1,513 | $50,040 | $10,000 | $40,040 |
| 2015 | $515 | $55,440 | $10,000 | $45,440 |
| 2014 | $719 | $44,640 | $10,000 | $34,640 |
| 2013 | -- | $32,640 | $8,000 | $24,640 |
Source: Public Records
Map
Nearby Homes
- 170 Summer Creek Cove
- 411 Summer Creek Dr
- 69 Due West Pass
- 5166 Dallas Acworth Hwy
- 0 Picketts Mill Rd Unit 10615536
- 000 Picketts Mill Rd
- 430 Autumn Creek Dr
- 143 Frances Dr
- 40 Red Maple Way
- 139 Autumn Creek Dr
- 49 Parkside Dr
- 134 Cedar Bay Cir
- 47 Sage Ct
- 89 Candy Lilly Ct
- 366 Charles Ridge Unit 53
- 77 Oliver Ridge
- 440 Colbert Rd
- 102 Silverleaf Ln
- 143 Summer Creek Cove
- 115 Summer Creek Cove
- 161 Summer Creek Cove
- 0 Summer Creek Cove
- 99 Summer Creek Cove
- 161 Summer Creek Dr
- 161 Summer Creek Cove
- 108 Summer Creek Place
- 124 Summer Creek Place
- 64 Summer Creek Place Unit 64
- 64 Summer Creek Place
- 83 Summer Creek Cove
- 136 Summer Creek Cove
- 116 Summer Creek Cove
- 42 Summer Creek Place
- 167 Summer Creek Cove
- 158 Summer Creek Cove
- 57 Summer Creek Cove
- 88 Summer Creek Cove
- 89 Summer Creek Place