129 Twin Brook Ln Bellingham, MA 02019
Estimated Value: $366,000 - $458,000
2
Beds
2
Baths
990
Sq Ft
$403/Sq Ft
Est. Value
About This Home
This home is located at 129 Twin Brook Ln, Bellingham, MA 02019 and is currently estimated at $398,738, approximately $402 per square foot. 129 Twin Brook Ln is a home located in Norfolk County with nearby schools including Stall Brook Elementary School, Bellingham High School, and Bethany Christian Academy.
Ownership History
Date
Name
Owned For
Owner Type
Purchase Details
Closed on
Apr 17, 2020
Sold by
Goodwin Cecile
Bought by
Goodwin Cayley
Current Estimated Value
Purchase Details
Closed on
May 9, 2016
Sold by
Fnma
Bought by
Goodwin Cecile
Purchase Details
Closed on
Jul 20, 2015
Sold by
Blanchette Cheryl A and Green Tree Servicing L
Bought by
Fnma
Purchase Details
Closed on
Nov 15, 1991
Sold by
Barrett Richard C and Barrett Elizabeth J
Bought by
Blanchette Cheryl A
Home Financials for this Owner
Home Financials are based on the most recent Mortgage that was taken out on this home.
Original Mortgage
$63,000
Interest Rate
8.8%
Mortgage Type
Purchase Money Mortgage
Create a Home Valuation Report for This Property
The Home Valuation Report is an in-depth analysis detailing your home's value as well as a comparison with similar homes in the area
Home Values in the Area
Average Home Value in this Area
Purchase History
| Date | Buyer | Sale Price | Title Company |
|---|---|---|---|
| Goodwin Cayley | -- | None Available | |
| Goodwin Cecile | $152,000 | -- | |
| Fnma | $132,829 | -- | |
| Blanchette Cheryl A | $80,000 | -- |
Source: Public Records
Mortgage History
| Date | Status | Borrower | Loan Amount |
|---|---|---|---|
| Previous Owner | Blanchette Cheryl A | $63,000 | |
| Closed | Blanchette Cheryl A | $8,500 |
Source: Public Records
Tax History Compared to Growth
Tax History
| Year | Tax Paid | Tax Assessment Tax Assessment Total Assessment is a certain percentage of the fair market value that is determined by local assessors to be the total taxable value of land and additions on the property. | Land | Improvement |
|---|---|---|---|---|
| 2025 | $4,064 | $323,600 | $0 | $323,600 |
| 2024 | $4,047 | $314,700 | $0 | $314,700 |
| 2023 | $3,779 | $289,600 | $0 | $289,600 |
| 2022 | $3,019 | $214,400 | $0 | $214,400 |
| 2021 | $2,925 | $203,000 | $0 | $203,000 |
| 2020 | $2,811 | $197,700 | $0 | $197,700 |
| 2019 | $2,448 | $172,300 | $0 | $172,300 |
| 2018 | $2,447 | $169,800 | $0 | $169,800 |
| 2017 | $2,327 | $162,300 | $0 | $162,300 |
| 2016 | $2,265 | $158,500 | $0 | $158,500 |
| 2015 | $2,259 | $158,500 | $0 | $158,500 |
| 2014 | $2,300 | $156,900 | $0 | $156,900 |
Source: Public Records
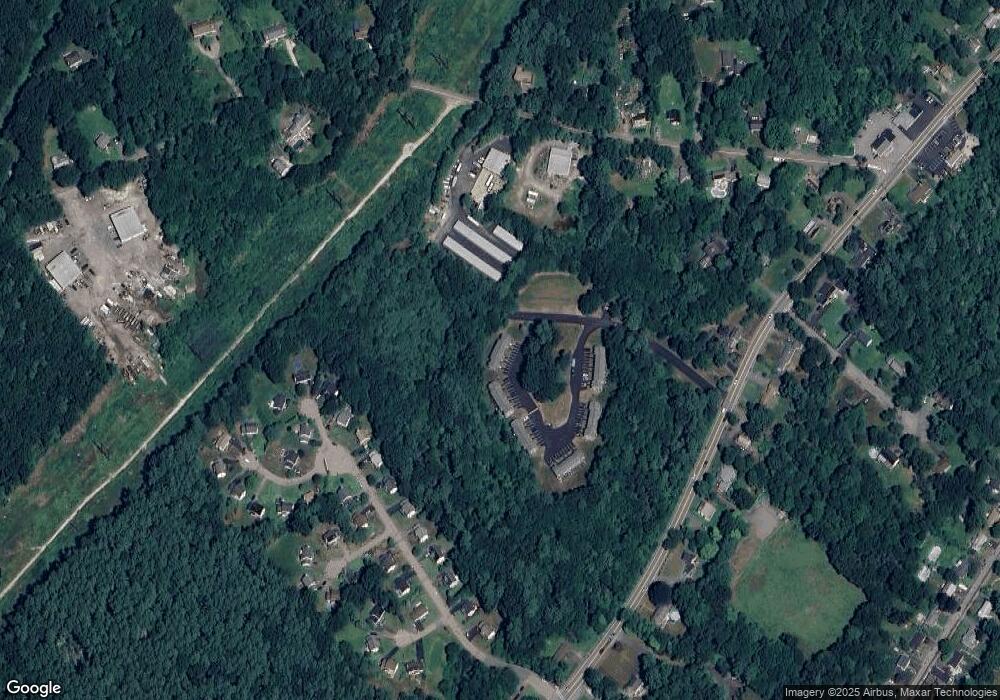
Map
Nearby Homes
- 0 Old Log Lane (Farm St) Unit 73416329
- 387 Hartford Ave
- 455 Hartford Ave
- 462 Hartford Ave
- 9 Tulip Way
- 39 West St
- 14 Hawthorne Village Unit D
- 4 Linda Ln
- 17 Pine St
- 60 Pine St
- 224 Main St
- 951 Pond St
- 220 Main St Unit 220
- 6 Freedom Trail
- 2 Kingson Ln Unit 2
- 0 Pond Unit 73416512
- 21 Riverside Rd
- 56 Fisher St
- 4 Deerfield Rd
- 00 Hixon St
- 131 Twin Brook Ln
- 132 Twin Brook Ln
- 130 Twin Brook Ln
- 128 Twin Brook Ln
- 128 Twin Brook Ln Unit 1
- 129 Twin Brook Ln Unit 129
- 124 Twin Brook Ln
- 127 Twin Brook Ln
- 126 Twin Brook Ln
- 123 Twin Brook Ln
- 123 Twin Brook Ln Unit 123
- 125 Twin Brook Ln
- 118 Twin Brook Ln
- 122 Twin Brook Ln
- 121 Twin Brook Ln
- 120 Twin Brook Ln
- 119 Twin Brook Ln
- 119 Twin Brook Ln Unit 119
- 119 Twin Brook Ln Unit 119,4
- 107 Twin Brook Ln