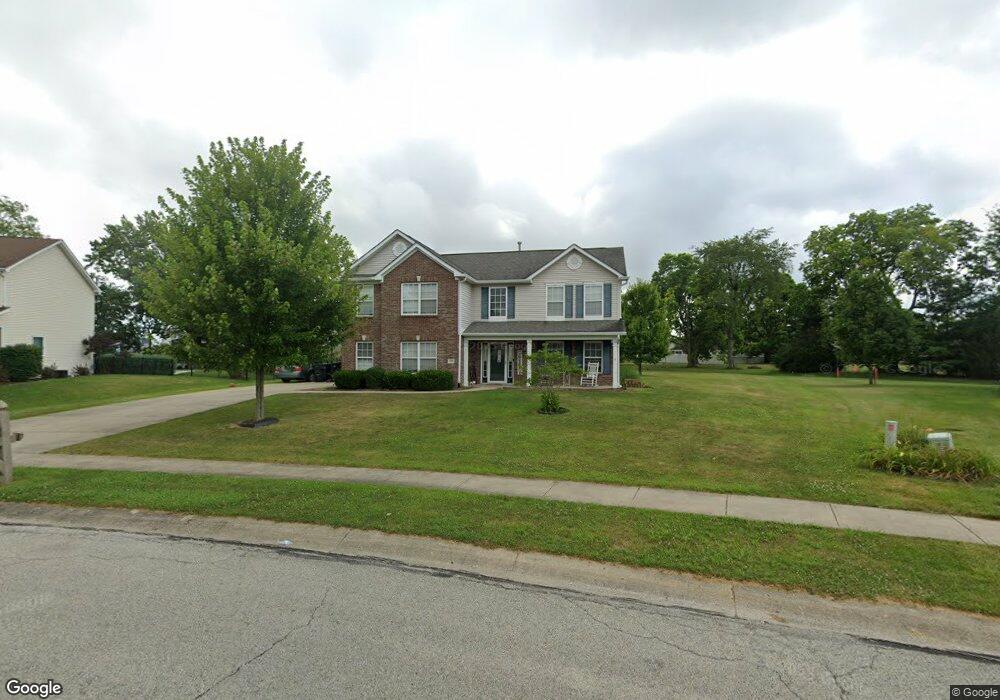
129 Vermilian Dr Whiteland, IN 46184
Estimated Value: $368,000 - $377,000
3
Beds
3
Baths
2,300
Sq Ft
$162/Sq Ft
Est. Value
About This Home
This home is located at 129 Vermilian Dr, Whiteland, IN 46184 and is currently estimated at $371,484, approximately $161 per square foot. 129 Vermilian Dr is a home located in Johnson County with nearby schools including Whiteland Elementary School, Clark-Pleasant Middle School, and Whiteland Community High School.
Ownership History
Date
Name
Owned For
Owner Type
Purchase Details
Closed on
Nov 17, 2023
Sold by
Nassif Blair M and Wilusz Blair M
Bought by
Wilusz Blair M
Current Estimated Value
Home Financials for this Owner
Home Financials are based on the most recent Mortgage that was taken out on this home.
Original Mortgage
$192,307
Outstanding Balance
$189,035
Interest Rate
7.63%
Mortgage Type
FHA
Estimated Equity
$182,449
Purchase Details
Closed on
Oct 9, 2014
Sold by
Nassif Blair
Bought by
Nassif Blair M and Anderson Aimee M
Purchase Details
Closed on
Nov 7, 2013
Sold by
Nassif Barry
Bought by
Nassif Blair
Purchase Details
Closed on
Jun 13, 2006
Sold by
Princeton Group Inc
Bought by
Nassif Barry and Nassif Blair
Home Financials for this Owner
Home Financials are based on the most recent Mortgage that was taken out on this home.
Original Mortgage
$194,265
Interest Rate
6.73%
Mortgage Type
Unknown
Create a Home Valuation Report for This Property
The Home Valuation Report is an in-depth analysis detailing your home's value as well as a comparison with similar homes in the area
Home Values in the Area
Average Home Value in this Area
Purchase History
| Date | Buyer | Sale Price | Title Company |
|---|---|---|---|
| Wilusz Blair M | -- | Security Title | |
| Nassif Blair M | -- | Nations Title | |
| Nassif Blair | -- | -- | |
| Nassif Barry | -- | None Available |
Source: Public Records
Mortgage History
| Date | Status | Borrower | Loan Amount |
|---|---|---|---|
| Open | Wilusz Blair M | $192,307 | |
| Previous Owner | Nassif Barry | $194,265 |
Source: Public Records
Tax History Compared to Growth
Tax History
| Year | Tax Paid | Tax Assessment Tax Assessment Total Assessment is a certain percentage of the fair market value that is determined by local assessors to be the total taxable value of land and additions on the property. | Land | Improvement |
|---|---|---|---|---|
| 2025 | $3,602 | $384,200 | $70,100 | $314,100 |
| 2024 | $3,602 | $343,800 | $70,100 | $273,700 |
| 2023 | $3,625 | $347,100 | $70,100 | $277,000 |
| 2022 | $3,181 | $305,300 | $61,500 | $243,800 |
| 2021 | $2,584 | $247,400 | $43,900 | $203,500 |
| 2020 | $2,488 | $236,700 | $43,900 | $192,800 |
| 2019 | $2,458 | $233,900 | $43,900 | $190,000 |
| 2018 | $2,347 | $224,500 | $40,700 | $183,800 |
| 2017 | $2,346 | $233,600 | $40,700 | $192,900 |
| 2016 | $2,122 | $212,200 | $40,700 | $171,500 |
| 2014 | $2,047 | $203,000 | $40,700 | $162,300 |
| 2013 | $2,047 | $204,700 | $40,700 | $164,000 |
Source: Public Records
Map
Nearby Homes
- 254 Halldale Dr
- 83 Palmetto Dr
- 372 Wert Ln
- 272 Mcnair Rd
- 288 Mcnair Rd
- 8 Marys Ct
- 4810 N Centerline Rd
- 241 Deborah Ln
- 338 Mcnair Rd
- 62 Wild Turkey Run
- Aruba Bay Plan at Briar Creek - Ranches
- Grand Bahama Plan at Briar Creek - Ranches
- Dominica Spring Plan at Briar Creek - Ranches
- Grand Cayman Plan at Briar Creek - Ranches
- 79 Gnarled Oak Ln
- 661 Woodview Dr
- Hudson with 3-Car Garage Plan at Briar Creek - Estates
- Columbia with 3-Car Garage Plan at Briar Creek - Estates
- 213 Mcnair Rd
- Lehigh with 3-Car Garage Plan at Briar Creek - Estates
- 150 Vermilian Dr
- 140 Vermilian Dr
- 273 Halldale Dr
- 119 Vermilian Dr
- 201 Vermilian Dr
- 110 Vermilian Dr
- 98 Vermilian Dr
- 292 Wild Turkey Run
- 263 Halldale Dr
- 264 Halldale Dr
- 109 Vermilian Dr
- 105 Vermilian Dr
- 282 Wild Turkey Run
- 112 Park Forest Dr N
- 102 Park Forest Dr N
- 298 Wild Turkey Run
- 88 Vermilian Dr
- 253 Halldale Dr
- 92 Park Forest Dr N
- 92 Park Forest Dr N Unit Whiteland