129 W 11th Ave Cordele, GA 31015
Estimated Value: $204,599
--
Bed
--
Bath
10,000
Sq Ft
$20/Sq Ft
Est. Value
About This Home
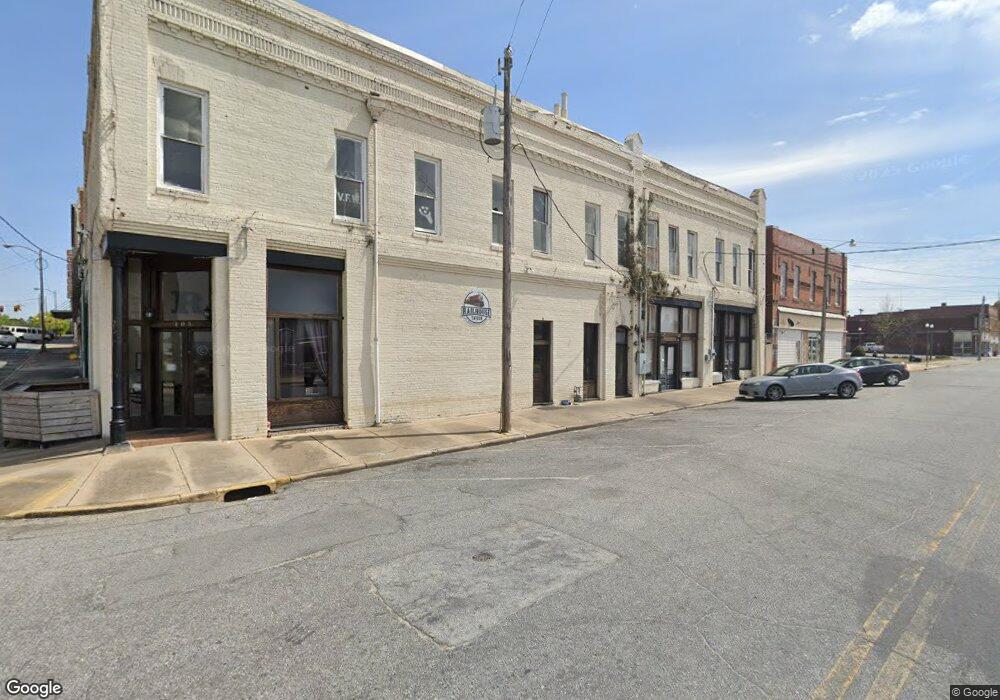
This home is located at 129 W 11th Ave, Cordele, GA 31015 and is currently estimated at $204,599, approximately $20 per square foot. 129 W 11th Ave is a home located in Crisp County with nearby schools including Crisp County Elementary School, Crisp County Primary School, and Crisp County Middle School.
Ownership History
Date
Name
Owned For
Owner Type
Purchase Details
Closed on
Apr 7, 2023
Sold by
The Binninger Family Trust
Bought by
Railhouse Tavern Llc
Current Estimated Value
Home Financials for this Owner
Home Financials are based on the most recent Mortgage that was taken out on this home.
Original Mortgage
$156,968
Outstanding Balance
$128,070
Interest Rate
6.73%
Mortgage Type
Mortgage Modification
Estimated Equity
$76,529
Purchase Details
Closed on
Jan 1, 2013
Sold by
The Binininger Family Trust
Bought by
The Binininger Family Trust
Purchase Details
Closed on
Dec 19, 2011
Sold by
Binninger Robert P
Bought by
Binninger Fam Trust
Purchase Details
Closed on
Oct 18, 2005
Sold by
Whipple Barbara Jean
Bought by
Binninger Robert P
Purchase Details
Closed on
Oct 13, 2005
Sold by
Mckenzie Robert Douglas
Bought by
Binninger Robert P
Create a Home Valuation Report for This Property
The Home Valuation Report is an in-depth analysis detailing your home's value as well as a comparison with similar homes in the area
Home Values in the Area
Average Home Value in this Area
Purchase History
| Date | Buyer | Sale Price | Title Company |
|---|---|---|---|
| Railhouse Tavern Llc | $190,000 | -- | |
| The Binininger Family Trust | $259,000 | -- | |
| Binninger Fam Trust | -- | -- | |
| Binninger Robert P | $29,500 | -- | |
| Binninger Robert P | $29,500 | -- |
Source: Public Records
Mortgage History
| Date | Status | Borrower | Loan Amount |
|---|---|---|---|
| Open | Railhouse Tavern Llc | $156,968 |
Source: Public Records
Tax History Compared to Growth
Tax History
| Year | Tax Paid | Tax Assessment Tax Assessment Total Assessment is a certain percentage of the fair market value that is determined by local assessors to be the total taxable value of land and additions on the property. | Land | Improvement |
|---|---|---|---|---|
| 2024 | $2,438 | $68,025 | $1,583 | $66,442 |
| 2023 | $1,690 | $45,085 | $1,583 | $43,502 |
| 2022 | $1,192 | $45,085 | $1,583 | $43,502 |
| 2021 | $1,168 | $45,085 | $1,583 | $43,502 |
| 2020 | $1,269 | $45,085 | $1,583 | $43,502 |
| 2019 | $1,279 | $45,085 | $1,583 | $43,502 |
| 2018 | $540 | $18,303 | $1,583 | $16,720 |
| 2017 | $743 | $18,303 | $1,583 | $16,720 |
| 2016 | $541 | $18,303 | $1,583 | $16,720 |
| 2015 | -- | $18,318 | $1,583 | $16,735 |
| 2014 | -- | $18,318 | $1,583 | $16,735 |
| 2013 | -- | $18,318 | $1,583 | $16,734 |
Source: Public Records
Map
Nearby Homes