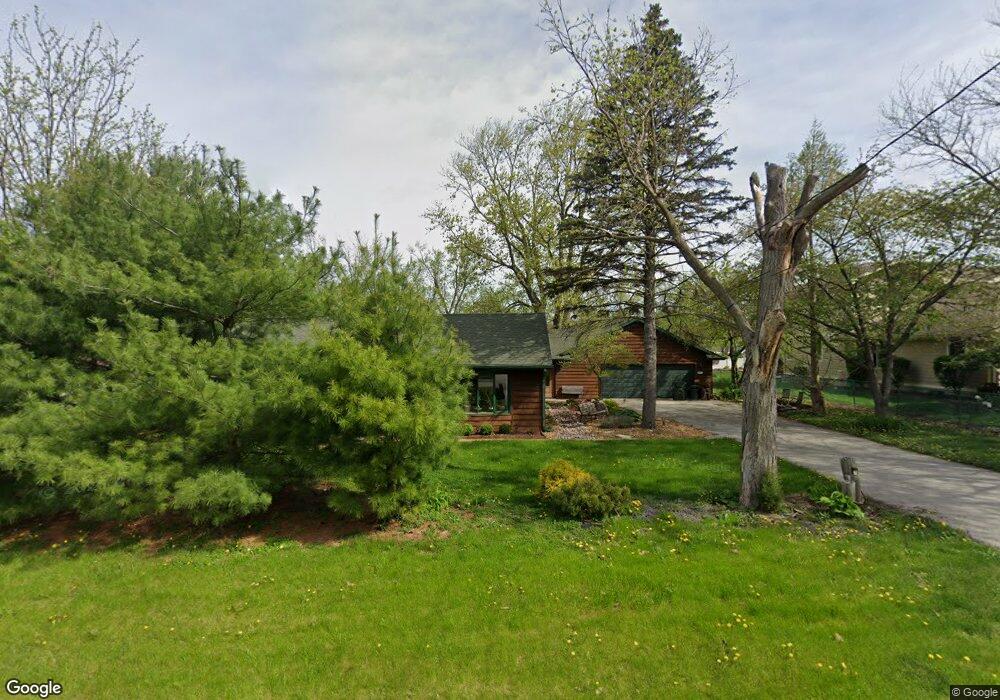
129 W Joliet Hwy New Lenox, IL 60451
Estimated Value: $337,645 - $402,000
3
Beds
2
Baths
1,834
Sq Ft
$208/Sq Ft
Est. Value
About This Home
This home is located at 129 W Joliet Hwy, New Lenox, IL 60451 and is currently estimated at $381,911, approximately $208 per square foot. 129 W Joliet Hwy is a home located in Will County with nearby schools including Bentley Elementary School, Arnold J Tyler School, and Alex M Martino Jr High School.
Ownership History
Date
Name
Owned For
Owner Type
Purchase Details
Closed on
Aug 18, 2017
Sold by
Bartel Roger and Boyd Annette
Bought by
Locascio Domenick
Current Estimated Value
Home Financials for this Owner
Home Financials are based on the most recent Mortgage that was taken out on this home.
Original Mortgage
$242,526
Outstanding Balance
$203,932
Interest Rate
4.25%
Mortgage Type
FHA
Estimated Equity
$177,979
Purchase Details
Closed on
Nov 30, 2006
Sold by
Boyd Douglas and Boyd Sharon
Bought by
Bartel Roger and Boyd Annette
Purchase Details
Closed on
May 29, 2003
Sold by
August George A and August Amy C
Bought by
Boyd Douglas E and Boyd Sharon V
Purchase Details
Closed on
May 1, 1998
Sold by
Financial Federal Trust & Svgs Bank
Bought by
August George A and Zemke Amy C
Home Financials for this Owner
Home Financials are based on the most recent Mortgage that was taken out on this home.
Original Mortgage
$109,250
Interest Rate
7.27%
Create a Home Valuation Report for This Property
The Home Valuation Report is an in-depth analysis detailing your home's value as well as a comparison with similar homes in the area
Home Values in the Area
Average Home Value in this Area
Purchase History
| Date | Buyer | Sale Price | Title Company |
|---|---|---|---|
| Locascio Domenick | $247,000 | Chicago Title | |
| Bartel Roger | -- | None Available | |
| Boyd Douglas E | $160,000 | -- | |
| August George A | $115,000 | Chicago Title Insurance Co |
Source: Public Records
Mortgage History
| Date | Status | Borrower | Loan Amount |
|---|---|---|---|
| Open | Locascio Domenick | $242,526 | |
| Previous Owner | August George A | $109,250 |
Source: Public Records
Tax History Compared to Growth
Tax History
| Year | Tax Paid | Tax Assessment Tax Assessment Total Assessment is a certain percentage of the fair market value that is determined by local assessors to be the total taxable value of land and additions on the property. | Land | Improvement |
|---|---|---|---|---|
| 2024 | $6,052 | $82,579 | $24,795 | $57,784 |
| 2023 | $6,052 | $75,278 | $22,603 | $52,675 |
| 2022 | $5,481 | $69,349 | $20,823 | $48,526 |
| 2021 | $5,190 | $65,220 | $19,583 | $45,637 |
| 2020 | $5,034 | $62,893 | $18,884 | $44,009 |
| 2019 | $4,811 | $60,942 | $18,298 | $42,644 |
| 2018 | $4,608 | $57,896 | $17,667 | $40,229 |
| 2017 | $4,372 | $56,231 | $17,159 | $39,072 |
| 2016 | $4,238 | $54,726 | $16,700 | $38,026 |
| 2015 | $4,092 | $53,003 | $16,174 | $36,829 |
| 2014 | $4,092 | $52,348 | $15,974 | $36,374 |
| 2013 | $4,092 | $53,053 | $16,189 | $36,864 |
Source: Public Records
Map
Nearby Homes
- 105 Roy St
- 00 NE Corner Cherry Hill Road and Moss Lane Rd
- 718 S Prairie Rd
- 319 S Pine St
- 15707 Valley View St
- 808 Stonegate Rd
- 574 Prairie Crossing Dr
- 235 Roberts Rd
- 416 Manor Ct Unit B
- 328 E Lincoln Hwy
- 524 Waverly Ct Unit D
- 329 Hancock Dr
- 218 Manor Dr Unit A
- 203 Tonell Ave
- 1046 Schoolgate Rd Unit 3
- 709 Young Dr
- 920 Barnside Rd
- 331 Old Hickory Rd
- 449 Somerset Ln Unit 1
- 1007 Nelson Rd
- 632 S Pine St
- 127 W Joliet Hwy
- 622 S Pine St
- 706 S Pine St
- 620 S Pine St Unit 2
- 128 W Joliet Hwy
- 205 W Joliet Hwy
- 107 W Joliet Hwy
- 110 W Joliet Hwy
- 708 S Pine St
- 625 S Pine St
- 616 S Pine St
- 208 W Joliet Hwy
- 621 S Pine St
- 621 S Pine St Unit 2
- 130 Central Rd
- 631 S Cedar Rd
- 102 W Joliet Hwy
- 211 W Joliet Hwy
- 114 Central Rd