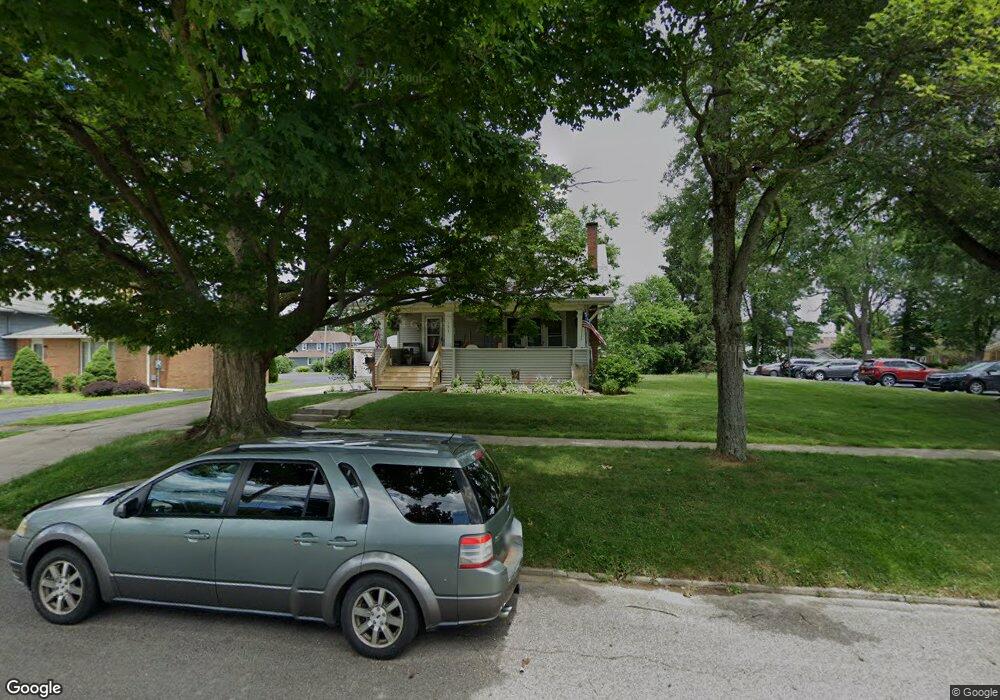
129 W Quarry St Newton Falls, OH 44444
Estimated Value: $127,000 - $246,000
4
Beds
2
Baths
1,542
Sq Ft
$121/Sq Ft
Est. Value
About This Home
This home is located at 129 W Quarry St, Newton Falls, OH 44444 and is currently estimated at $187,343, approximately $121 per square foot. 129 W Quarry St is a home located in Trumbull County with nearby schools including Newton Falls Middle School, Newton Falls Junior High School, and Newton Falls High School.
Ownership History
Date
Name
Owned For
Owner Type
Purchase Details
Closed on
Nov 21, 2017
Sold by
Jpmorgan Chase Bank Na
Bought by
Howell Kimberly and Howell Frank
Current Estimated Value
Purchase Details
Closed on
Sep 11, 2017
Sold by
Running Charles E
Bought by
Jpmorgan Chase Bank Na
Purchase Details
Closed on
Sep 9, 2010
Sold by
Kazimer Nancy J and Kazimer Nancy
Bought by
Running Charles E
Home Financials for this Owner
Home Financials are based on the most recent Mortgage that was taken out on this home.
Original Mortgage
$93,276
Interest Rate
4.54%
Mortgage Type
New Conventional
Purchase Details
Closed on
Jan 1, 1990
Bought by
Nancy J Kazimer
Create a Home Valuation Report for This Property
The Home Valuation Report is an in-depth analysis detailing your home's value as well as a comparison with similar homes in the area
Home Values in the Area
Average Home Value in this Area
Purchase History
| Date | Buyer | Sale Price | Title Company |
|---|---|---|---|
| Howell Kimberly | $27,400 | None Available | |
| Jpmorgan Chase Bank Na | $40,000 | None Available | |
| Running Charles E | $90,000 | South Park Title Agency Inc | |
| Nancy J Kazimer | -- | -- |
Source: Public Records
Mortgage History
| Date | Status | Borrower | Loan Amount |
|---|---|---|---|
| Previous Owner | Running Charles E | $93,276 |
Source: Public Records
Tax History Compared to Growth
Tax History
| Year | Tax Paid | Tax Assessment Tax Assessment Total Assessment is a certain percentage of the fair market value that is determined by local assessors to be the total taxable value of land and additions on the property. | Land | Improvement |
|---|---|---|---|---|
| 2024 | $2,102 | $47,260 | $2,980 | $44,280 |
| 2023 | $2,102 | $47,260 | $2,980 | $44,280 |
| 2022 | $1,393 | $27,130 | $2,980 | $24,150 |
| 2021 | $1,478 | $27,130 | $2,980 | $24,150 |
| 2020 | $1,373 | $27,130 | $2,980 | $24,150 |
| 2019 | $1,386 | $25,770 | $2,980 | $22,790 |
| 2018 | $1,346 | $25,770 | $2,980 | $22,790 |
| 2017 | $1,344 | $25,770 | $2,980 | $22,790 |
| 2016 | $1,265 | $24,290 | $3,010 | $21,280 |
| 2015 | $1,260 | $24,290 | $3,010 | $21,280 |
| 2014 | $1,100 | $24,290 | $3,010 | $21,280 |
| 2013 | $1,124 | $26,390 | $3,010 | $23,380 |
Source: Public Records
Map
Nearby Homes
- 38 W 8th St
- 0 W Woodland Ave
- 535 Park Ave
- 328 Oak Knoll Ave
- 83 Maple Dr
- 344 Arlington Blvd
- 348 Arlington Blvd
- 0 2nd St
- 5484 Scott St
- 1 Olive St
- 2617 W River Rd
- 0 State Route 5 Unit 5085736
- 4409 Ophelia St
- 998 Woodglen Ave
- 4374 Richmond Ave
- 2721 E River Rd
- 4454 Warren Ravenna Rd
- 2445 Newton Tomlinson Rd
- 3250 State Route 534
- 2702 McMullen Allen Rd
- 129 W Quarry St Unit D
- 131 W Quarry St
- 131 W Quarry St
- 136 W Church St
- 142 W Church St
- 128 W Church St
- 146 - 150 W Church St
- 120 W Church St
- 146 W Church St
- 128 W Quarry St
- 134 W Quarry St
- 122 W Quarry St
- 116 W Quarry St
- 207 Ravenna Rd
- 140 W Quarry St
- 304 S Canal St
- 150 W Church St
- 146 W Quarry St
- 310 S Canal St
- 208 Ravenna Rd Unit 10