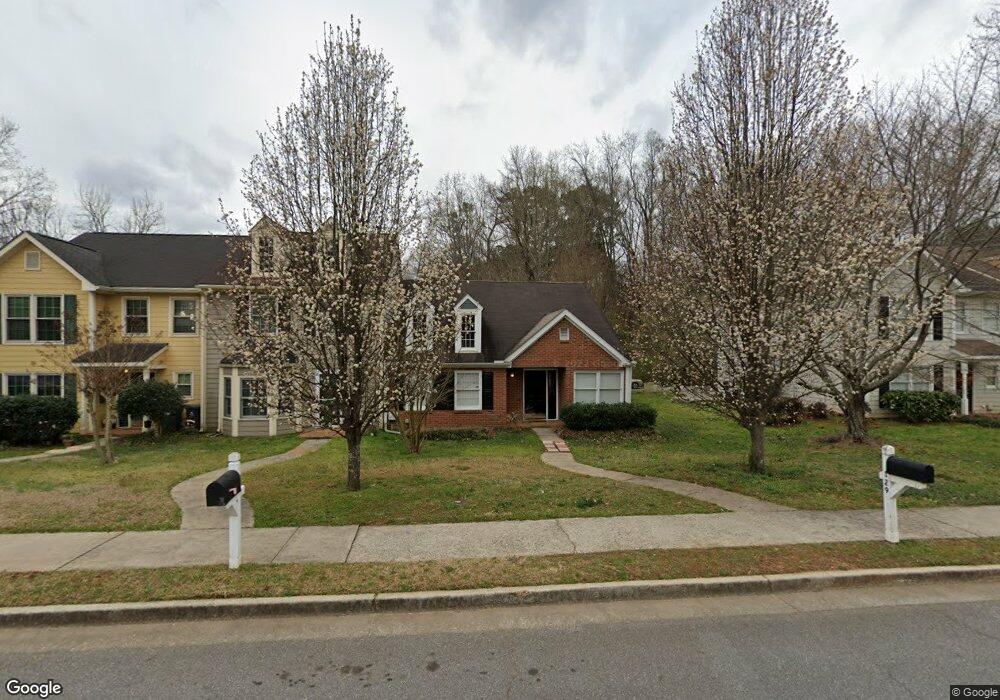
129 Willow Stream Ct Roswell, GA 30076
Estimated Value: $269,000 - $301,000
2
Beds
2
Baths
1,301
Sq Ft
$217/Sq Ft
Est. Value
About This Home
This home is located at 129 Willow Stream Ct, Roswell, GA 30076 and is currently estimated at $282,967, approximately $217 per square foot. 129 Willow Stream Ct is a home located in Fulton County with nearby schools including Mimosa Elementary School, Elkins Pointe Middle School, and Roswell High School.
Ownership History
Date
Name
Owned For
Owner Type
Purchase Details
Closed on
Jun 24, 2002
Sold by
Delavie Jeanine K and Delavie Nancy K
Bought by
Schubert Randall J
Current Estimated Value
Home Financials for this Owner
Home Financials are based on the most recent Mortgage that was taken out on this home.
Original Mortgage
$80,000
Outstanding Balance
$33,491
Interest Rate
6.67%
Mortgage Type
New Conventional
Estimated Equity
$249,476
Purchase Details
Closed on
Jul 22, 1999
Sold by
Delavie Daniel G and Delavie Jeanine K
Bought by
Delavie Jeanine K and Delavie Nancy K
Home Financials for this Owner
Home Financials are based on the most recent Mortgage that was taken out on this home.
Original Mortgage
$30,000
Interest Rate
7.66%
Mortgage Type
New Conventional
Purchase Details
Closed on
Mar 30, 1994
Sold by
Green Jo Anne
Bought by
Delavie Jeanine K Daniel G
Home Financials for this Owner
Home Financials are based on the most recent Mortgage that was taken out on this home.
Original Mortgage
$51,600
Interest Rate
7.26%
Create a Home Valuation Report for This Property
The Home Valuation Report is an in-depth analysis detailing your home's value as well as a comparison with similar homes in the area
Home Values in the Area
Average Home Value in this Area
Purchase History
| Date | Buyer | Sale Price | Title Company |
|---|---|---|---|
| Schubert Randall J | $117,000 | -- | |
| Delavie Jeanine K | -- | -- | |
| Delavie Jeanine K Daniel G | $70,000 | -- |
Source: Public Records
Mortgage History
| Date | Status | Borrower | Loan Amount |
|---|---|---|---|
| Open | Schubert Randall J | $80,000 | |
| Previous Owner | Delavie Jeanine K | $30,000 | |
| Previous Owner | Delavie Jeanine K Daniel G | $51,600 |
Source: Public Records
Tax History
| Year | Tax Paid | Tax Assessment Tax Assessment Total Assessment is a certain percentage of the fair market value that is determined by local assessors to be the total taxable value of land and additions on the property. | Land | Improvement |
|---|---|---|---|---|
| 2025 | $755 | $110,040 | $18,120 | $91,920 |
| 2023 | $2,391 | $84,720 | $15,200 | $69,520 |
| 2022 | $695 | $71,520 | $14,880 | $56,640 |
| 2021 | $121 | $54,200 | $9,360 | $44,840 |
| 2020 | $792 | $55,200 | $7,520 | $47,680 |
| 2018 | $1,080 | $50,360 | $10,480 | $39,880 |
| 2017 | $400 | $23,240 | $4,320 | $18,920 |
| 2016 | $398 | $23,240 | $4,320 | $18,920 |
Source: Public Records
Map
Nearby Homes
- 146 Willow Stream Ct
- 155 Willow Stream Ct
- 173 Willow Stream Ct
- 1130 Worthington Hills Dr
- 10630 Worthington Hills Manor
- 912 Holcomb Bridge Rd
- 3009 Park Ave
- 10016 Jack Dr
- 1007 Belle Ave
- 420 Old Holcomb Bridge Rd
- 810 Kenway Ave
- 355 Walker Ave
- 250 Walker Ave
- 1150 Harper Dr
- 320 Walker Ave
- 1110 Harper Dr
- 223 High Creek Dr Unit 3A
- 236 Chads Ford Way Unit 4B
- 228 Chads Ford Way
- 236 High Creek Dr
- 127 Willow Stream Ct
- 131 Willow Stream Ct
- 133 Willow Stream Ct
- 125 Willow Stream Ct
- 135 Willow Stream Ct
- 137 Willow Stream Ct
- 1282 Warsaw Rd
- 1280 Warsaw Rd
- 1278 Warsaw Rd Unit 1278
- 1278 Warsaw Rd
- 1278 Warsaw Rd Unit na
- 144 Willow Stream Ct
- 139 Willow Stream Ct
- 142 Willow Stream Ct
- 1286 Warsaw Rd
- 1286 Warsaw Rd Unit 1286
- 140 Willow Stream Ct
- 1276 Warsaw Rd Unit 1276
- 1276 Warsaw Rd
- 1276 Warsaw Rd
Your Personal Tour Guide
Ask me questions while you tour the home.