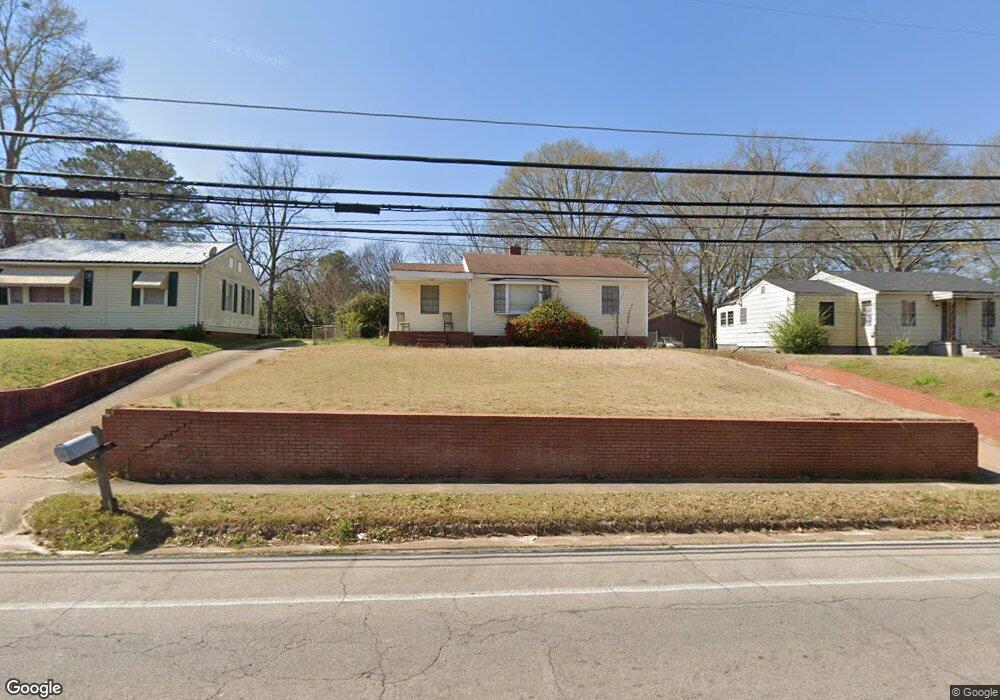
129 Youngs Mill Rd Lagrange, GA 30241
Estimated Value: $92,000 - $142,000
2
Beds
1
Bath
929
Sq Ft
$125/Sq Ft
Est. Value
About This Home
This home is located at 129 Youngs Mill Rd, Lagrange, GA 30241 and is currently estimated at $115,758, approximately $124 per square foot. 129 Youngs Mill Rd is a home located in Troup County with nearby schools including Franklin Forest Elementary School, Hollis Hand Elementary School, and Ethel W. Kight Elementary School.
Ownership History
Date
Name
Owned For
Owner Type
Purchase Details
Closed on
Aug 25, 2010
Sold by
Grier James
Bought by
Barnes James C
Current Estimated Value
Purchase Details
Closed on
Jul 29, 2005
Sold by
Grier James
Bought by
Grier James and Grier Mildred Rebecca
Purchase Details
Closed on
Feb 12, 2002
Sold by
Jack Dewane Bowen
Bought by
Lillian C Bowen
Purchase Details
Closed on
Dec 21, 1984
Sold by
Moman Hulit D and Moman Brenda B
Bought by
Jack Dewane Bowen
Purchase Details
Closed on
Nov 5, 1984
Sold by
Brown James B
Bought by
Moman Hulit D and Moman Brenda B
Purchase Details
Closed on
Mar 14, 1977
Sold by
Jones Adell Walker
Bought by
Brown James B
Purchase Details
Closed on
Aug 10, 1971
Sold by
Matthews Curtis and Matthews Virginia
Bought by
Jones Adell Walker
Purchase Details
Closed on
Jan 1, 1952
Sold by
Brown James B
Bought by
Matthews Curtis and Matthews Virginia
Create a Home Valuation Report for This Property
The Home Valuation Report is an in-depth analysis detailing your home's value as well as a comparison with similar homes in the area
Purchase History
| Date | Buyer | Sale Price | Title Company |
|---|---|---|---|
| Barnes James C | $28,000 | -- | |
| Grier James | -- | -- | |
| Lillian C Bowen | -- | -- | |
| Jack Dewane Bowen | $19,000 | -- | |
| Moman Hulit D | -- | -- | |
| Brown James B | $12,000 | -- | |
| Jones Adell Walker | $13,000 | -- | |
| Matthews Curtis | -- | -- |
Source: Public Records
Tax History
| Year | Tax Paid | Tax Assessment Tax Assessment Total Assessment is a certain percentage of the fair market value that is determined by local assessors to be the total taxable value of land and additions on the property. | Land | Improvement |
|---|---|---|---|---|
| 2025 | $792 | $33,208 | $8,000 | $25,208 |
| 2024 | $792 | $29,052 | $8,000 | $21,052 |
| 2023 | $663 | $24,304 | $6,120 | $18,184 |
| 2022 | $652 | $23,344 | $6,120 | $17,224 |
| 2021 | $487 | $16,152 | $6,120 | $10,032 |
| 2020 | $487 | $16,152 | $6,120 | $10,032 |
| 2019 | $448 | $14,844 | $5,520 | $9,324 |
| 2018 | $448 | $14,844 | $5,520 | $9,324 |
| 2017 | $448 | $14,844 | $5,520 | $9,324 |
| 2016 | $457 | $15,152 | $5,538 | $9,614 |
| 2015 | $397 | $13,135 | $5,538 | $7,597 |
| 2014 | $385 | $12,735 | $5,538 | $7,197 |
| 2013 | -- | $13,272 | $5,538 | $7,734 |
Source: Public Records
Map
Nearby Homes
- 204 Cleveland Dr
- 212 Cleveland Dr
- 130 Clara Jean Ct
- 110 Lenox Cir
- 210 Hearthstone Dr
- 121 Ct
- 305 Lenox Cir
- 0 N Barnard Ave
- 107 N Barnard Ave
- 5 Curran Ave
- 618 S Harlem Cir
- 616 S Harlem Cir
- 706 N Harlem Cir
- 4 1/2 Barnard Ave
- 608 S Harlem Cir
- 104 Sheila St
- 606 S Harlem Cir
- 101 Sarah Ln
- 227 River Meadow Dr Unit H14
- 227 River Meadow Dr
- 119 Youngs Mill Rd
- 133 Youngs Mill Rd
- 115 Youngs Mill Rd
- 137 Youngs Mill Rd
- 265 Rutland Cir
- 267 Rutland Cir
- 269 Rutland Cir
- 263 Rutland Cir
- 263 Rutland Cir Unit 14
- 147 Youngs Mill Rd
- 271 Rutland Cir
- 138 Youngs Mill Rd
- 101 Youngs Mill Rd
- 100 Rutland Cir
- 100 Rutland Cir Unit 8
- 273 Rutland Cir
- 144 Youngs Mill Rd
- 261 Rutland Cir
- 157 Youngs Mill Rd
- 103 Bonaventure Dr