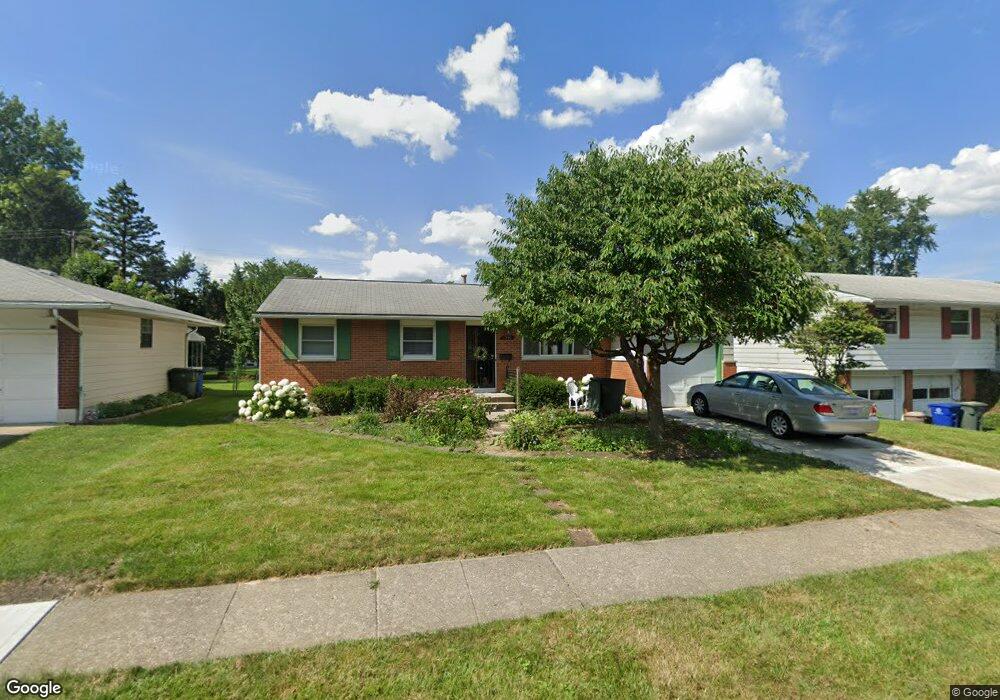
1290 Belden Rd Columbus, OH 43229
Woodward Park NeighborhoodEstimated Value: $256,409 - $273,000
3
Beds
2
Baths
1,176
Sq Ft
$228/Sq Ft
Est. Value
About This Home
This home is located at 1290 Belden Rd, Columbus, OH 43229 and is currently estimated at $268,102, approximately $227 per square foot. 1290 Belden Rd is a home located in Franklin County with nearby schools including Valley Forge Elementary School, Woodward Park Middle School, and Northland High School.
Ownership History
Date
Name
Owned For
Owner Type
Purchase Details
Closed on
Oct 24, 2022
Sold by
Denis Scott R and Denis Martha N
Bought by
Scott And Martha Denis Trust
Current Estimated Value
Purchase Details
Closed on
Mar 15, 2006
Sold by
Bc Developing Llc
Bought by
Denis Scott R and Denis Martha N
Home Financials for this Owner
Home Financials are based on the most recent Mortgage that was taken out on this home.
Original Mortgage
$96,000
Interest Rate
6.25%
Mortgage Type
Fannie Mae Freddie Mac
Purchase Details
Closed on
Dec 15, 2005
Sold by
Lewis Gary L
Bought by
Bc Developing Llc
Purchase Details
Closed on
Apr 19, 1999
Sold by
Lewis Laura L
Bought by
Lewis Gary L
Home Financials for this Owner
Home Financials are based on the most recent Mortgage that was taken out on this home.
Original Mortgage
$21,132
Interest Rate
7.04%
Mortgage Type
Seller Take Back
Purchase Details
Closed on
May 1, 1978
Bought by
Lewis Gary L
Purchase Details
Closed on
Mar 1, 1978
Create a Home Valuation Report for This Property
The Home Valuation Report is an in-depth analysis detailing your home's value as well as a comparison with similar homes in the area
Home Values in the Area
Average Home Value in this Area
Purchase History
| Date | Buyer | Sale Price | Title Company |
|---|---|---|---|
| Scott And Martha Denis Trust | -- | -- | |
| Denis Scott R | $141,000 | Independent | |
| Bc Developing Llc | $102,000 | 21St Centu | |
| Lewis Gary L | -- | -- | |
| Lewis Gary L | -- | -- | |
| -- | $37,100 | -- |
Source: Public Records
Mortgage History
| Date | Status | Borrower | Loan Amount |
|---|---|---|---|
| Previous Owner | Denis Scott R | $96,000 | |
| Previous Owner | Lewis Gary L | $21,132 |
Source: Public Records
Tax History Compared to Growth
Tax History
| Year | Tax Paid | Tax Assessment Tax Assessment Total Assessment is a certain percentage of the fair market value that is determined by local assessors to be the total taxable value of land and additions on the property. | Land | Improvement |
|---|---|---|---|---|
| 2024 | $3,636 | $79,350 | $21,560 | $57,790 |
| 2023 | $3,741 | $79,345 | $21,560 | $57,785 |
| 2022 | $2,547 | $47,920 | $11,340 | $36,580 |
| 2021 | $2,551 | $47,920 | $11,340 | $36,580 |
| 2020 | $2,555 | $47,920 | $11,340 | $36,580 |
| 2019 | $2,440 | $39,240 | $9,070 | $30,170 |
| 2018 | $1,218 | $39,240 | $9,070 | $30,170 |
| 2017 | $2,439 | $39,240 | $9,070 | $30,170 |
| 2016 | $2,487 | $36,610 | $8,400 | $28,210 |
| 2015 | $1,132 | $36,610 | $8,400 | $28,210 |
| 2014 | $2,270 | $36,610 | $8,400 | $28,210 |
| 2013 | $1,179 | $38,535 | $8,855 | $29,680 |
Source: Public Records
Map
Nearby Homes
- 1385 Thurell Rd
- 4983 Almont Dr
- 4904 Almont Dr
- 1485 Norma Rd
- 1414 Alvina Dr
- 4840 Almont Dr
- 1125 Upland Dr
- 4815 Bourke Rd
- 4923 Karl Rd Unit 4925
- 4816 Bourke Rd
- 1116 Tulsa Dr
- 4791 Bourke Rd
- 4852 Colonel Perry Dr
- 5246 Eisenhower Rd
- 4800 Bourke Rd
- 1493 Boxwood Dr
- 4761 Colonel Perry Dr
- 5022 Sienna Ln
- 5318 Eisenhower Rd
- 964 Strimple Ave