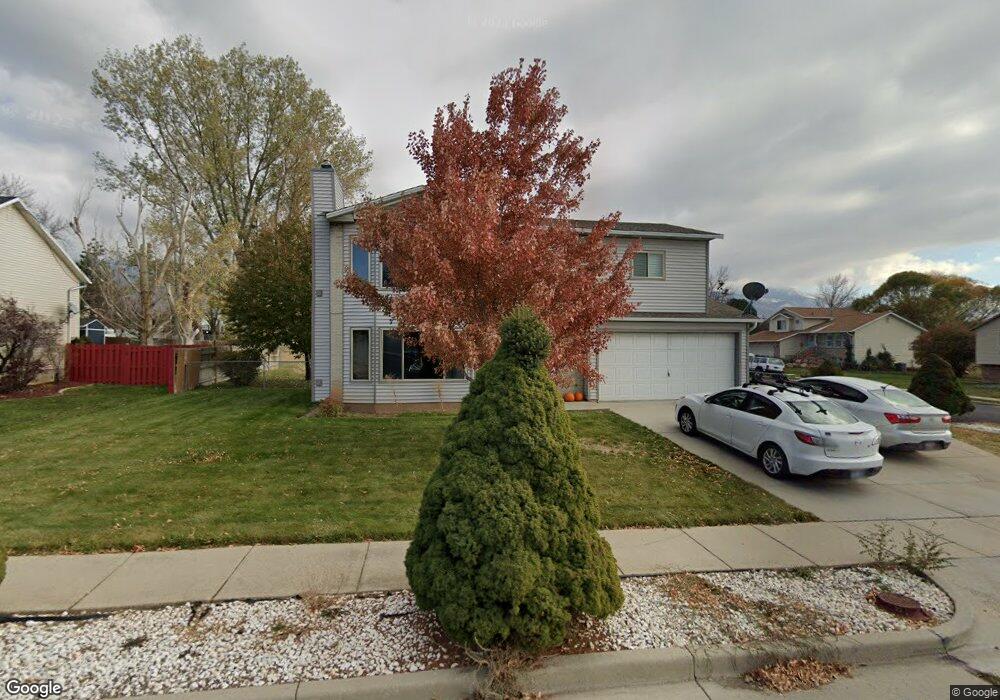
1290 N 950 E Layton, UT 84040
Estimated Value: $472,000 - $487,000
3
Beds
2
Baths
1,932
Sq Ft
$247/Sq Ft
Est. Value
About This Home
This home is located at 1290 N 950 E, Layton, UT 84040 and is currently estimated at $477,514, approximately $247 per square foot. 1290 N 950 E is a home located in Davis County with nearby schools including King Elementary School, Central Davis Junior High School, and Layton High School.
Ownership History
Date
Name
Owned For
Owner Type
Purchase Details
Closed on
Apr 25, 2022
Sold by
Babler Gary D and Babler Virginia
Bought by
Young Andrew M and Young Brittney T
Current Estimated Value
Home Financials for this Owner
Home Financials are based on the most recent Mortgage that was taken out on this home.
Original Mortgage
$26,805
Outstanding Balance
$25,395
Interest Rate
5.11%
Mortgage Type
New Conventional
Estimated Equity
$452,119
Purchase Details
Closed on
Nov 20, 2001
Sold by
Vigil Tod D and Vigil Debra J
Bought by
Babler Gary D and Babler Virginia
Create a Home Valuation Report for This Property
The Home Valuation Report is an in-depth analysis detailing your home's value as well as a comparison with similar homes in the area
Home Values in the Area
Average Home Value in this Area
Purchase History
| Date | Buyer | Sale Price | Title Company |
|---|---|---|---|
| Young Andrew M | -- | Old Republic Title | |
| Babler Gary D | -- | Mountain View Title & Escrow |
Source: Public Records
Mortgage History
| Date | Status | Borrower | Loan Amount |
|---|---|---|---|
| Open | Young Andrew M | $26,805 | |
| Open | Young Andrew M | $446,758 |
Source: Public Records
Tax History
| Year | Tax Paid | Tax Assessment Tax Assessment Total Assessment is a certain percentage of the fair market value that is determined by local assessors to be the total taxable value of land and additions on the property. | Land | Improvement |
|---|---|---|---|---|
| 2025 | $2,085 | $218,900 | $112,240 | $106,660 |
| 2024 | $1,992 | $210,650 | $135,886 | $74,764 |
| 2023 | $1,969 | $367,000 | $185,524 | $181,476 |
| 2022 | $2,087 | $384,000 | $180,564 | $203,436 |
| 2021 | $1,928 | $291,000 | $150,816 | $140,184 |
| 2020 | $1,692 | $245,000 | $120,833 | $124,167 |
| 2019 | $1,664 | $236,000 | $108,217 | $127,783 |
| 2018 | $1,503 | $214,000 | $83,254 | $130,746 |
| 2016 | $1,286 | $94,490 | $44,025 | $50,465 |
| 2015 | $1,226 | $85,470 | $46,342 | $39,128 |
| 2014 | $1,157 | $82,499 | $46,342 | $36,157 |
| 2013 | -- | $99,239 | $22,748 | $76,491 |
Source: Public Records
Map
Nearby Homes
- 1048 E Cherry Ln
- 1258 E North Lisa St
- 997 E 825 N
- 1033 E 825 N
- 1266 E Larkspur Way
- 1340 E Hollyhock Way
- 1354 E Hollyhock Way
- 1305 E Larkspur Way
- 1350 Kays Creek Dr
- 1156 Cherrywood Dr
- 1920 N Camellia Way Unit 406
- 1930 N Camellia Way E Unit 407
- 1476 Kays Creek Dr
- 1545 E 975 N
- 861 E 575 N
- 227 E 1500 N
- 556 N Fairfield Rd Unit A2
- 556 N Fairfield Rd Unit D1
- 556 N Fairfield Rd Unit D2
- 556 N Fairfield Rd Unit A3
- 1290 Plum Tree Dr
- 1310 Plum Tree Dr
- 969 Springtree Dr
- 1277 N 950 E
- 1297 Plum Tree Dr
- 1297 N 950 E
- 1324 Plum Tree Dr
- 1277 Plum Tree Dr
- 962 Springtree Dr
- 1319 Plum Tree Dr
- 1261 Plum Tree Dr
- 985 E 1275 N
- 985 Springtree Dr
- 978 Springtree Dr
- 1306 N Cherry Stem Cir Unit 5
- 986 E 1275 N
- 1340 Plum Tree Dr
- 1340 N 950 E
- 1339 Plum Tree Dr
- 986 Springtree Dr
Your Personal Tour Guide
Ask me questions while you tour the home.