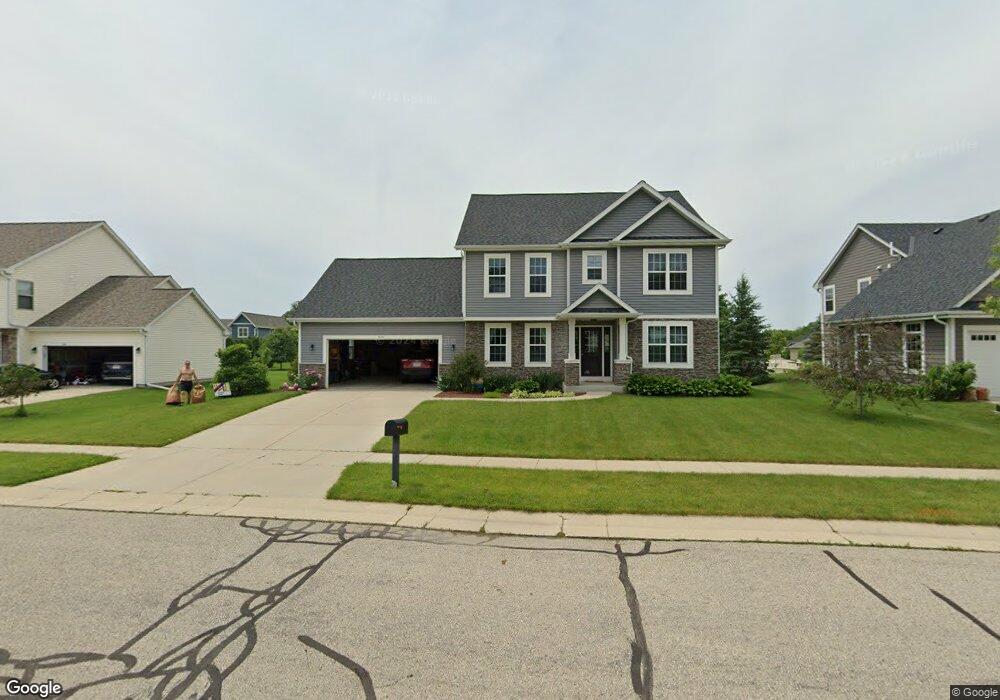
1290 Niagara Rd Oconomowoc, WI 53066
Estimated Value: $506,000 - $663,000
--
Bed
--
Bath
--
Sq Ft
0.34
Acres
About This Home
This home is located at 1290 Niagara Rd, Oconomowoc, WI 53066 and is currently estimated at $601,606. 1290 Niagara Rd is a home located in Waukesha County with nearby schools including Greenland Elementary School, Nature Hill Intermediate School, and Oconomowoc High School.
Ownership History
Date
Name
Owned For
Owner Type
Purchase Details
Closed on
May 19, 2021
Sold by
Spoke Laura
Bought by
Spoke Thomas
Current Estimated Value
Home Financials for this Owner
Home Financials are based on the most recent Mortgage that was taken out on this home.
Original Mortgage
$355,500
Outstanding Balance
$321,159
Interest Rate
2.9%
Mortgage Type
New Conventional
Estimated Equity
$280,447
Purchase Details
Closed on
Jul 18, 2013
Sold by
Loos Custom Homes Llc
Bought by
Spoke Tom and Spoke Laura
Home Financials for this Owner
Home Financials are based on the most recent Mortgage that was taken out on this home.
Original Mortgage
$282,000
Interest Rate
4.02%
Mortgage Type
Construction
Purchase Details
Closed on
Mar 13, 2013
Sold by
Lakewood Estates North Llc
Bought by
Loos Custom Homes Llc
Purchase Details
Closed on
Jul 14, 2011
Sold by
Jc Fleming Properties Inc
Bought by
Lakewood Estates North Llc
Create a Home Valuation Report for This Property
The Home Valuation Report is an in-depth analysis detailing your home's value as well as a comparison with similar homes in the area
Home Values in the Area
Average Home Value in this Area
Purchase History
| Date | Buyer | Sale Price | Title Company |
|---|---|---|---|
| Spoke Thomas | -- | None Available | |
| Spoke Tom | $60,000 | None Available | |
| Loos Custom Homes Llc | $240,000 | None Available | |
| Lakewood Estates North Llc | -- | None Available |
Source: Public Records
Mortgage History
| Date | Status | Borrower | Loan Amount |
|---|---|---|---|
| Open | Spoke Thomas | $355,500 | |
| Closed | Spoke Tom | $282,000 |
Source: Public Records
Tax History Compared to Growth
Tax History
| Year | Tax Paid | Tax Assessment Tax Assessment Total Assessment is a certain percentage of the fair market value that is determined by local assessors to be the total taxable value of land and additions on the property. | Land | Improvement |
|---|---|---|---|---|
| 2024 | $5,843 | $545,600 | $110,000 | $435,600 |
| 2023 | $5,768 | $514,100 | $110,000 | $404,100 |
| 2022 | $6,426 | $467,200 | $110,000 | $357,200 |
| 2021 | $5,685 | $418,800 | $110,000 | $308,800 |
| 2020 | $5,674 | $327,100 | $88,000 | $239,100 |
| 2019 | $5,504 | $327,100 | $88,000 | $239,100 |
| 2018 | $4,998 | $307,400 | $88,000 | $219,400 |
| 2017 | $4,960 | $307,400 | $88,000 | $219,400 |
| 2016 | $5,016 | $307,400 | $88,000 | $219,400 |
| 2015 | $4,989 | $307,400 | $88,000 | $219,400 |
| 2014 | $1,279 | $307,400 | $88,000 | $219,400 |
| 2013 | $1,279 | $77,100 | $77,100 | $0 |
Source: Public Records
Map
Nearby Homes
- 460 Niagara Rd
- Pcl4 Poppy St
- 1431 Crystal Lake Dr
- 711 E Lisbon Rd
- N55W37033 Harvard St
- 1230 Oriole Dr
- 503 N Lake Rd Unit 2
- 503 N Lake Rd Unit 5
- N65W38025 Woodlake Dr
- N65W38047 Woodlake Dr
- N65W38069 Woodlake Dr
- N65W38089 Woodlake Dr
- N65W38024 Woodlake Dr
- N56W36834 E Lisbon Rd
- 333 N Lake Rd Unit 507
- N65W38111 Woodlake Dr
- N65W38131 Woodlake Dr
- 1084 Spruce Ct
- N65W38151 Woodlake Dr
- N65W38102 Woodlake Dr
- 1294 Niagara Rd
- 1286 Niagara Rd
- 1289 Victoria Ln
- 1293 Niagara Rd
- 1282 Niagara Rd
- 1281 Victoria Ln
- 1285 Niagara Rd
- 1289 Niagara Rd
- 1281 Niagara Rd
- 1275 Victoria Ln
- 1295 Niagara Rd
- 1291 Niagara Rd
- 1297 Niagara Rd
- 1276 Niagara Rd
- 1269 Victoria Ln
- 1292 Blue Dahlia Rd
- 1290 Blue Dahlia Rd
- 1296 Blue Dahlia Rd
- 1274 Niagara Rd
- 1288 Blue Dahlia Rd