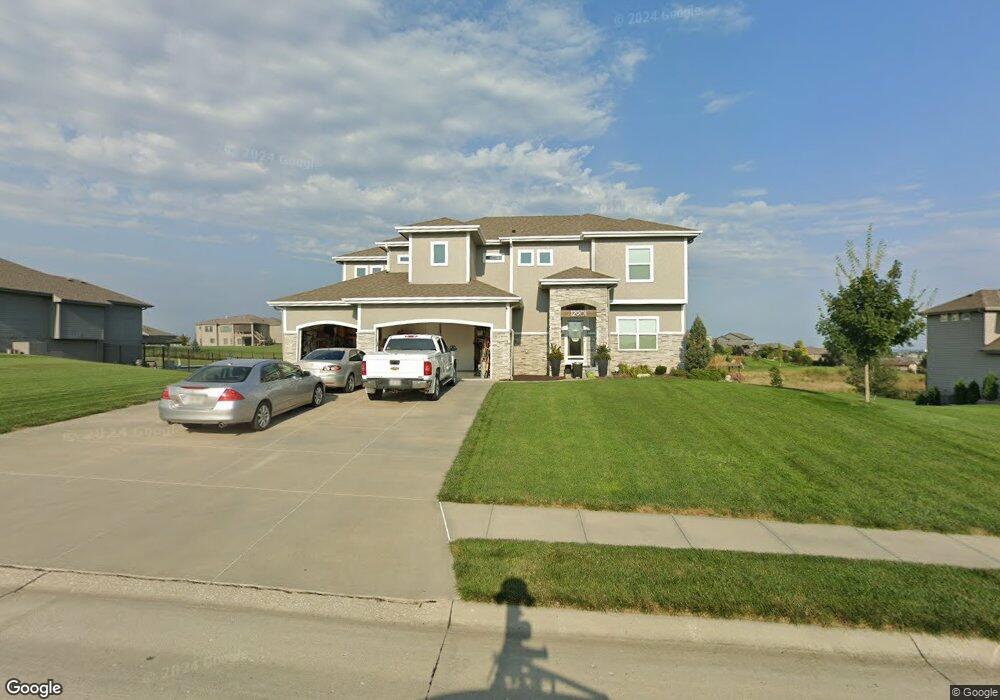
12901 N 184th St Unit Lot 35 Bennington, NE 68007
Estimated Value: $738,843 - $1,054,000
5
Beds
4
Baths
3,191
Sq Ft
$264/Sq Ft
Est. Value
About This Home
This home is located at 12901 N 184th St Unit Lot 35, Bennington, NE 68007 and is currently estimated at $841,961, approximately $263 per square foot. 12901 N 184th St Unit Lot 35 is a home located in Douglas County with nearby schools including Bennington High School.
Ownership History
Date
Name
Owned For
Owner Type
Purchase Details
Closed on
Jul 31, 2018
Sold by
Henzel Brenda J and Henzel Jeffrey L
Bought by
Caldwell Paul D and Caldwell Maja M
Current Estimated Value
Home Financials for this Owner
Home Financials are based on the most recent Mortgage that was taken out on this home.
Original Mortgage
$380,000
Outstanding Balance
$329,327
Interest Rate
4.5%
Mortgage Type
New Conventional
Estimated Equity
$512,634
Purchase Details
Closed on
May 17, 2017
Sold by
The Home Company Llc
Bought by
Henzel Brenda J and Henzel Jeffrey L
Home Financials for this Owner
Home Financials are based on the most recent Mortgage that was taken out on this home.
Original Mortgage
$424,100
Interest Rate
4.1%
Mortgage Type
New Conventional
Purchase Details
Closed on
Sep 26, 2016
Sold by
Jbi Newport Heritage Llc
Bought by
The Home Co Llc
Create a Home Valuation Report for This Property
The Home Valuation Report is an in-depth analysis detailing your home's value as well as a comparison with similar homes in the area
Home Values in the Area
Average Home Value in this Area
Purchase History
| Date | Buyer | Sale Price | Title Company |
|---|---|---|---|
| Caldwell Paul D | $475,000 | Rts Title & Escrow | |
| Henzel Brenda J | $460,000 | None Available | |
| The Home Co Llc | $74,000 | None Available |
Source: Public Records
Mortgage History
| Date | Status | Borrower | Loan Amount |
|---|---|---|---|
| Open | Caldwell Paul D | $380,000 | |
| Previous Owner | Henzel Brenda J | $424,100 |
Source: Public Records
Tax History Compared to Growth
Tax History
| Year | Tax Paid | Tax Assessment Tax Assessment Total Assessment is a certain percentage of the fair market value that is determined by local assessors to be the total taxable value of land and additions on the property. | Land | Improvement |
|---|---|---|---|---|
| 2025 | $12,298 | $562,600 | $50,000 | $512,600 |
| 2024 | $14,253 | $522,100 | $50,000 | $472,100 |
| 2023 | $14,253 | $522,100 | $50,000 | $472,100 |
| 2022 | $13,528 | $477,600 | $50,000 | $427,600 |
| 2021 | $13,523 | $477,600 | $50,000 | $427,600 |
| 2020 | $13,604 | $477,600 | $50,000 | $427,600 |
| 2019 | $12,613 | $453,000 | $50,000 | $403,000 |
| 2018 | $12,641 | $453,000 | $50,000 | $403,000 |
| 2017 | $6,899 | $245,000 | $50,000 | $195,000 |
| 2016 | $1,076 | $37,800 | $37,800 | $0 |
| 2015 | $344 | $13,800 | $13,800 | $0 |
| 2014 | $344 | $12,500 | $12,500 | $0 |
Source: Public Records
Map
Nearby Homes
- 11004 N 161 Ave
- 10913 N 159 Ave Unit Lot 9
- 11010 N 161 St Unit Lot 68
- 11123 N 161 Ave Unit Lot 47
- 16001 Abigail St Unit Lot 19
- 15959 Abigail St Unit Lot 17
- 11131 N 161 Ave
- 11004 N 161 Ave Unit Lot 33
- Lot 26 Bennington Park Land W
- Lot 79 Bennington Park Land W
- Lot 78 Bennington Park Land W
- Lot 77 Bennington Park Land W
- Lot 75 Bennington Park Land W
- Lot 73 Bennington Park Land W
- Lot 65 Bennington Park Land W
- Lot 36 Bennington Park Land W
- Lot 38 Bennington Park Land W
- Lot 39 Bennington Park Land W
- Lot 35 Bennington Park Land W
- Lot 32 Bennington Park Land W
- 12901 N 184th St
- 12825 N 184th St Unit Lot 36
- 12825 N 184th St
- 12909 N 184th St Unit Lot 34
- 12909 N 184th St
- 12917 N 184th St Unit Lot 33
- 12917 N 184th St
- 12817 N 184th St
- 12817 N 184th St Unit Lot 37
- 12926 N 182nd St
- 12902 N 184th St
- 12902 N 184th St Unit Lot 25
- 12918 N 182nd St
- 12918 N 182nd St Unit Lot 47
- 12828 N 184th St
- 12828 N 184th St Unit Lot 24
- 18302 Northern Hills Dr
- 12910 N 184th St
- 12910 N 184th St Unit Lot 26
- 12820 N 184th St Unit Lot 23