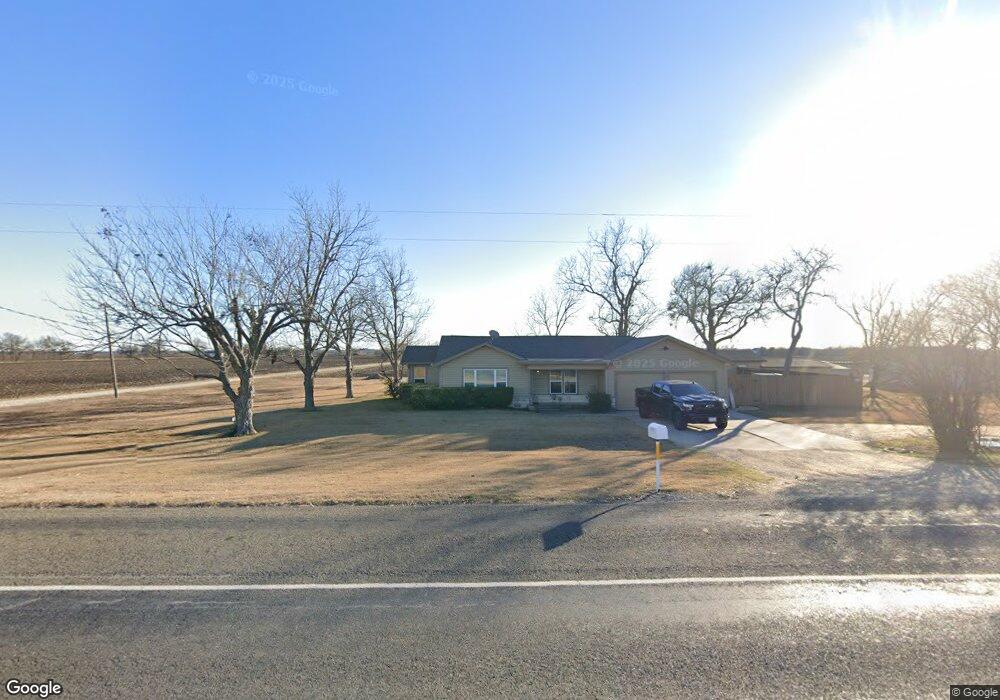
12901 State Highway 53 Temple, TX 76501
Estimated Value: $223,803 - $297,000
2
Beds
1
Bath
1,212
Sq Ft
$219/Sq Ft
Est. Value
About This Home
This home is located at 12901 State Highway 53, Temple, TX 76501 and is currently estimated at $264,951, approximately $218 per square foot. 12901 State Highway 53 is a home located in Bell County with nearby schools including Rogers Elementary School, Rogers Middle, and Rogers High School.
Ownership History
Date
Name
Owned For
Owner Type
Purchase Details
Closed on
Jul 13, 2016
Sold by
Partnership Triple T
Bought by
Buckholt Green Chad Aaron and Buckholt Green Avery
Current Estimated Value
Home Financials for this Owner
Home Financials are based on the most recent Mortgage that was taken out on this home.
Original Mortgage
$75,000
Interest Rate
3.66%
Mortgage Type
Purchase Money Mortgage
Purchase Details
Closed on
Mar 15, 2010
Sold by
Sefcik Randy Ray and Sefcik Lisa
Bought by
Green Chad A
Home Financials for this Owner
Home Financials are based on the most recent Mortgage that was taken out on this home.
Original Mortgage
$76,095
Interest Rate
5.5%
Mortgage Type
FHA
Purchase Details
Closed on
Jan 30, 1997
Sold by
Krahulik Joe B and Krahulik Dolphina
Bought by
Sefcik Vaclav and Sefcik Matilda R
Create a Home Valuation Report for This Property
The Home Valuation Report is an in-depth analysis detailing your home's value as well as a comparison with similar homes in the area
Home Values in the Area
Average Home Value in this Area
Purchase History
| Date | Buyer | Sale Price | Title Company |
|---|---|---|---|
| Buckholt Green Chad Aaron | -- | Central And Title Company | |
| Green Chad A | -- | Monteith Abstract & Title Co | |
| Sefcik Vaclav | -- | -- |
Source: Public Records
Mortgage History
| Date | Status | Borrower | Loan Amount |
|---|---|---|---|
| Closed | Buckholt Green Chad Aaron | $75,000 | |
| Previous Owner | Green Chad A | $76,095 |
Source: Public Records
Tax History Compared to Growth
Tax History
| Year | Tax Paid | Tax Assessment Tax Assessment Total Assessment is a certain percentage of the fair market value that is determined by local assessors to be the total taxable value of land and additions on the property. | Land | Improvement |
|---|---|---|---|---|
| 2025 | $1,317 | $181,377 | -- | -- |
| 2024 | $1,317 | $164,888 | -- | -- |
| 2023 | $2,149 | $149,898 | $0 | $0 |
| 2022 | $2,206 | $136,271 | $0 | $0 |
| 2021 | $2,067 | $126,825 | $11,578 | $115,247 |
| 2020 | $1,941 | $112,621 | $11,578 | $101,043 |
| 2019 | $1,899 | $103,954 | $11,578 | $92,376 |
| 2018 | $1,767 | $96,571 | $11,506 | $85,065 |
| 2017 | $1,749 | $92,670 | $9,224 | $83,446 |
| 2016 | $1,653 | $87,570 | $6,942 | $80,628 |
| 2015 | $1,302 | $84,475 | $4,369 | $80,106 |
| 2014 | $1,302 | $82,241 | $0 | $0 |
Source: Public Records
Map
Nearby Homes
- 310 Hruskaville Rd
- 916 Stone Rd
- Dove Lot: 0000 Texas 53
- Bluebonnet Lot: 0000 Texas 53
- Alamo Lot: 0000 Texas 53
- 0000 Texas 53
- TBD Texas 53
- 3515 Stone Rd
- 9681 State Highway 53
- 9562 State Highway 53
- 11247 Farm-To-market 2086
- 3510 Cen-Tex Loop
- TBD Texas 53
- 14308 Fm 2904
- Tract 3C Airville Rd
- Tract 4 Airville Rd
- TBD Airville Rd
- 2228 Fm 437
- 10966 Stringtown Rd
- 3830 Content School Rd
- 13017 Sugar Cane Ln
- 380 Seaton Rd
- 13439 State Highway 53
- 13291 Sugar Cane Ln
- 13229 Sugar Cane Ln
- 12211 State Highway 53
- 12135 State Highway 53
- 12040 State Highway 53
- 161 Hruskaville Rd
- 221 Hruskaville Rd
- 865 Hruskaville Rd
- 101 Hruskaville Rd
- 1170 Seaton Rd
- 000 Stone Rd
- 0000 Stone Rd
- 13851 State Highway 53
- 811 Hruskaville Rd
- 14503 Fm 2086
- 11891 State Highway 53
- 25 Stone Rd