


12902 129th St NE Lake Stevens, WA 98258
Estimated payment $7,019/month
Highlights
- Airport or Runway
- RV Access or Parking
- Deck
- Spa
- Gated Community
- Secluded Lot
About This Home
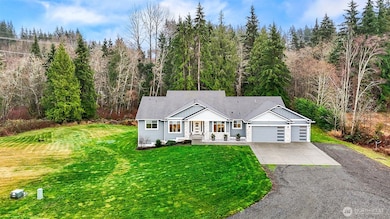
Located in the Highly Prestigious Frontier Air Park Aviation Community, on 5.09 acres with Air Rights allowing Runway Access, this Custom Robinett Home features Vaulted Ceilings, Massive Windows with Custom Blinds, Blackout Bedroom Shades, and Refreshed Carpet. The Kitchen Showcases Stainless Steel Appliances, Gas Cooktop, Quartz Counters and a 9ft Island overlooking the Great Room. The spacious Primary Suite includes a Free-Standing Tub and Oversized Walk In Closet. Additional comforts include a Heat Pump, Tankless Hot Water Heater, Office Featuring French Doors with Built-In Desk, Hardwired for Generator, Custom Patio with Hot Tub, Covered Deck with Gas Fireplace, Enormous Driveway with space for RV Parking and Outbuildings.
Source: Northwest Multiple Listing Service (NWMLS)
MLS#: 2457021
Home Details
Home Type
- Single Family
Est. Annual Taxes
- $8,421
Year Built
- Built in 2020
Lot Details
- 5.09 Acre Lot
- West Facing Home
- Gated Home
- Secluded Lot
- Level Lot
- Wooded Lot
- Garden
- 30060500403400
- Property is in very good condition
HOA Fees
- $83 Monthly HOA Fees
Parking
- 3 Car Attached Garage
- Driveway
- RV Access or Parking
Home Design
- Traditional Architecture
- Poured Concrete
- Composition Roof
- Stone Siding
- Cement Board or Planked
- Stone
Interior Spaces
- 2,549 Sq Ft Home
- 1-Story Property
- Vaulted Ceiling
- Gas Fireplace
- French Doors
- Dining Room
- Territorial Views
Kitchen
- Stove
- Microwave
- Dishwasher
- Disposal
Flooring
- Carpet
- Vinyl Plank
Bedrooms and Bathrooms
- 3 Main Level Bedrooms
- Walk-In Closet
- Bathroom on Main Level
- Freestanding Bathtub
Laundry
- Dryer
- Washer
Home Security
- Home Security System
- Storm Windows
Outdoor Features
- Spa
- Deck
- Patio
Schools
- Mtn Way Elementary School
- Granite Falls Mid Middle School
- Granite Falls High School
Utilities
- High Efficiency Air Conditioning
- High Efficiency Heating System
- Heat Pump System
- Generator Hookup
- Propane
- Shared Well
- Water Heater
- Septic Tank
- High Speed Internet
Listing and Financial Details
- Assessor Parcel Number 30060500403400
Community Details
Overview
- Association fees include road maintenance, security, snow removal
- Board@Frontierairpark.Org Association
- Built by Robinett Brothers Construction
- Frontier Air Park Subdivision
- The community has rules related to covenants, conditions, and restrictions
Additional Features
- Airport or Runway
- Gated Community
Map
Home Values in the Area
Average Home Value in this Area
Tax History
| Year | Tax Paid | Tax Assessment Tax Assessment Total Assessment is a certain percentage of the fair market value that is determined by local assessors to be the total taxable value of land and additions on the property. | Land | Improvement |
|---|---|---|---|---|
| 2025 | $8,055 | $968,300 | $381,500 | $586,800 |
| 2024 | $8,055 | $967,000 | $374,100 | $592,900 |
| 2023 | $7,802 | $977,500 | $378,600 | $598,900 |
| 2022 | $6,983 | $702,100 | $223,200 | $478,900 |
| 2020 | $1,334 | $157,000 | $152,300 | $4,700 |
| 2019 | $1,239 | $125,400 | $125,400 | $0 |
| 2018 | $1,475 | $128,100 | $128,100 | $0 |
| 2017 | $950 | $83,300 | $83,300 | $0 |
| 2016 | $1,074 | $88,600 | $88,600 | $0 |
| 2015 | $633 | $97,100 | $97,100 | $0 |
| 2013 | $1,491 | $101,100 | $101,100 | $0 |
Property History
| Date | Event | Price | List to Sale | Price per Sq Ft |
|---|---|---|---|---|
| 12/10/2025 12/10/25 | For Sale | $1,185,000 | -- | $465 / Sq Ft |
Purchase History
| Date | Type | Sale Price | Title Company |
|---|---|---|---|
| Warranty Deed | $810,000 | Chicago Title | |
| Warranty Deed | $160,000 | Chicago Title | |
| Warranty Deed | $143,750 | Pnwt |
Mortgage History
| Date | Status | Loan Amount | Loan Type |
|---|---|---|---|
| Open | $648,000 | New Conventional | |
| Previous Owner | $22,750 | Seller Take Back |
Source: Northwest Multiple Listing Service (NWMLS)
MLS Number: 2457021
APN: 300605-004-034-00
Disclaimer: Certain information contained herein is derived from information provided by parties other than Homes.com. All information provided is deemed reliable, but is not guaranteed to be accurate and should be independently verified.
![]() All data is obtained from various sources and may not have been verified by broker or MLS GRID. Supplied Open House Information is subject to change without notice. All information should be independently reviewed and verified for accuracy. Properties may or may not be listed by the office/agent presenting the information. Listing information is provided by the Northwest Multiple Listing Service (NWMLS). Property information is based on available data that may include MLS information, county records, and other sources. Listings marked with the 3 tree icon and provided by NWMLS. All properties are subject to prior sale or withdrawal. IDX information is provided exclusively for consumers’ personal noncommercial use, that it may not be used for any purpose other than to identify prospective properties consumers may be interested in purchasing, that the data is deemed reliable but is not guaranteed by MLS GRID. ©2025 NWMLS.
All data is obtained from various sources and may not have been verified by broker or MLS GRID. Supplied Open House Information is subject to change without notice. All information should be independently reviewed and verified for accuracy. Properties may or may not be listed by the office/agent presenting the information. Listing information is provided by the Northwest Multiple Listing Service (NWMLS). Property information is based on available data that may include MLS information, county records, and other sources. Listings marked with the 3 tree icon and provided by NWMLS. All properties are subject to prior sale or withdrawal. IDX information is provided exclusively for consumers’ personal noncommercial use, that it may not be used for any purpose other than to identify prospective properties consumers may be interested in purchasing, that the data is deemed reliable but is not guaranteed by MLS GRID. ©2025 NWMLS.
Based on information submitted to the MLS GRID
- 11927 137th Dr NE
- 11504 128th Dr NE
- 11309 127th Ave NE
- 11828 138th St NE
- 14517 117th St NE
- 10426 134th Ave NE Unit 108
- 10603 134th Ave NE Unit 102
- 10717 132nd Ave NE Unit 1
- 10610 134th Ave NE
- 10610 134th Ave NE Unit 111
- 10527 134th Ave NE Unit 103
- Harmon Plan at Kokanee Estates
- 10526 134th Dr NE Unit 110
- 10527 134th Ave NE
- Harris Plan at Kokanee Estates
- 10623 134th Ave NE
- Darius Plan at Kokanee Estates
- Hastings Plan at Kokanee Estates
- 11731 108th St NE
- 14416 110th St NE
- 106 Cascade Ave
- 10114 Mountain Loop Hwy Unit 28/12
- 17327 67th Ave NE
- 8450 67th Ave NE
- 14500 51st Ave NE
- 4921 100th St NE
- 18725 67th Ave NE
- 9912 48th Dr NE
- 7900-7980 200th St NE
- 13051 41st Ave NE
- 12115 State Ave
- 8564 52nd Place NE
- 16612 51st Ave NE
- 11923 State Ave
- 20227 77th Ave NE
- 20505 Olympic Place NE
- 8510 212th St NE
- 625 S Stillaguamish Ave
- 20310 74th Ave NE
- 20721 Olympic Place NE
