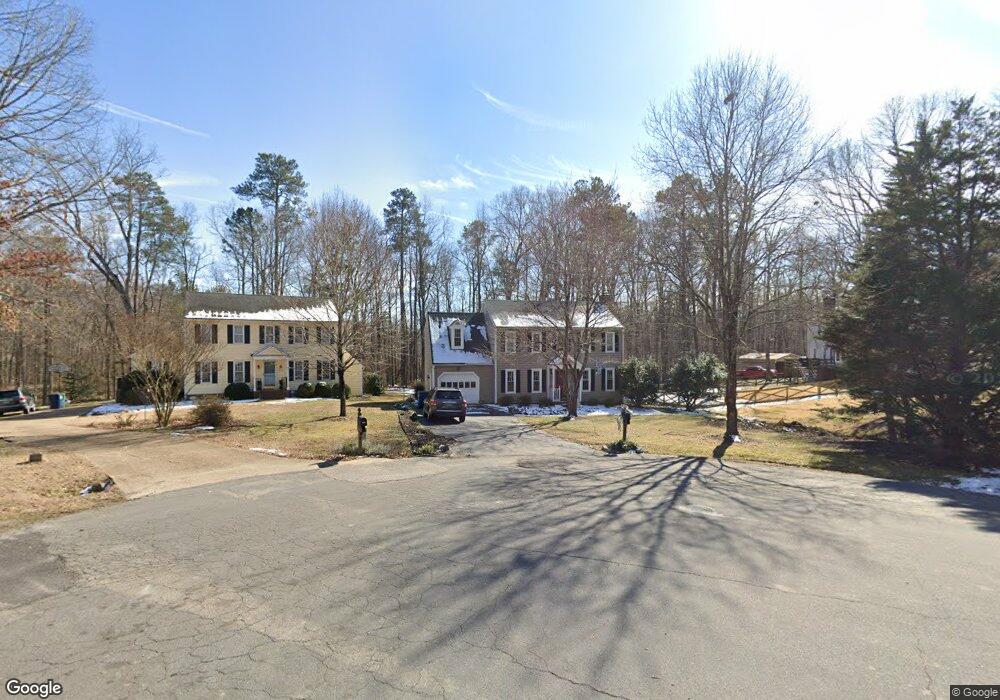
12903 Watch Point East Midlothian, VA 23114
Estimated Value: $437,000 - $473,000
4
Beds
3
Baths
2,098
Sq Ft
$220/Sq Ft
Est. Value
About This Home
This home is located at 12903 Watch Point East, Midlothian, VA 23114 and is currently estimated at $460,560, approximately $219 per square foot. 12903 Watch Point East is a home located in Chesterfield County with nearby schools including J B Watkins Elementary School, Midlothian Middle School, and Midlothian High School.
Ownership History
Date
Name
Owned For
Owner Type
Purchase Details
Closed on
Dec 3, 2013
Sold by
Mielck Edmund
Bought by
Amend Catherine H
Current Estimated Value
Home Financials for this Owner
Home Financials are based on the most recent Mortgage that was taken out on this home.
Original Mortgage
$228,530
Interest Rate
3.87%
Mortgage Type
FHA
Purchase Details
Closed on
Aug 8, 2008
Sold by
Dorsey Gregory P
Bought by
Mielck Edmund
Home Financials for this Owner
Home Financials are based on the most recent Mortgage that was taken out on this home.
Original Mortgage
$207,960
Interest Rate
6.49%
Mortgage Type
New Conventional
Purchase Details
Closed on
Dec 4, 1998
Sold by
Serfass Paul W
Bought by
Dorsey Gregory F and Dorsey Julia S
Home Financials for this Owner
Home Financials are based on the most recent Mortgage that was taken out on this home.
Original Mortgage
$133,932
Interest Rate
6.68%
Mortgage Type
FHA
Create a Home Valuation Report for This Property
The Home Valuation Report is an in-depth analysis detailing your home's value as well as a comparison with similar homes in the area
Home Values in the Area
Average Home Value in this Area
Purchase History
| Date | Buyer | Sale Price | Title Company |
|---|---|---|---|
| Amend Catherine H | $240,000 | -- | |
| Mielck Edmund | $259,950 | -- | |
| Dorsey Gregory F | $134,000 | -- |
Source: Public Records
Mortgage History
| Date | Status | Borrower | Loan Amount |
|---|---|---|---|
| Open | Dorsey Gregory F | $218,100 | |
| Closed | Amend Catherine H | $228,530 | |
| Previous Owner | Mielck Edmund | $207,960 | |
| Previous Owner | Dorsey Gregory F | $133,932 |
Source: Public Records
Tax History Compared to Growth
Tax History
| Year | Tax Paid | Tax Assessment Tax Assessment Total Assessment is a certain percentage of the fair market value that is determined by local assessors to be the total taxable value of land and additions on the property. | Land | Improvement |
|---|---|---|---|---|
| 2025 | $3,676 | $410,200 | $83,300 | $326,900 |
| 2024 | $3,676 | $375,500 | $76,300 | $299,200 |
| 2023 | $3,317 | $364,500 | $74,300 | $290,200 |
| 2022 | $3,076 | $334,300 | $70,300 | $264,000 |
| 2021 | $2,877 | $295,900 | $68,300 | $227,600 |
| 2020 | $2,669 | $280,900 | $65,300 | $215,600 |
| 2019 | $2,574 | $270,900 | $65,300 | $205,600 |
| 2018 | $2,503 | $263,500 | $65,100 | $198,400 |
| 2017 | $2,459 | $256,100 | $65,100 | $191,000 |
| 2016 | $2,424 | $252,500 | $63,000 | $189,500 |
| 2015 | $2,329 | $240,000 | $60,900 | $179,100 |
| 2014 | $2,227 | $229,400 | $58,800 | $170,600 |
Source: Public Records
Map
Nearby Homes
- 1301 Wesanne Ln
- 1400 Cedar Crossing Trail
- 1001 Worsham Green Terrace
- 1406 Walton Bluff Terrace
- 419 Walton Park Rd
- 12831 Ashtree Rd
- 13300 Railey Hill Dr
- 12918 Ashtree Rd
- 1618 Darrell Terrace
- 12601 Cottage Mill Rd
- 12909 Edgetree Terrace
- 914 Spirea Rd
- 13425 Ridgemoor Ln
- 1407 Sycamore Ridge Ct
- 12325 Logan Trace Rd
- 11970 Lucks Ln
- 11630 Smoketree Dr
- 11506 Glenmont Rd
- 11960 Lucks Ln
- 13201 Garland Ln
- 12903 Watch Point East
- 12901 Watch Point East
- 905 Watch Hill Rd
- 903 Watch Hill Rd
- 12901 Watch Point E
- 12900 Watch Point E
- 12900 Watch Point East
- 901 Watch Hill Rd
- 907 Watch Hill Rd
- 12902 Watch Point East
- 12904 Watch Point East
- 12902 Watch Point E
- 863 Watch Hill Rd
- 906 Watch Hill Rd
- 13001 Watch Point W
- 857 Watch Hill Rd
- 13001 Watch Point West
- 902 Watch Hill Rd
- 904 Watch Hill Rd
- 12903 Carefree Ct