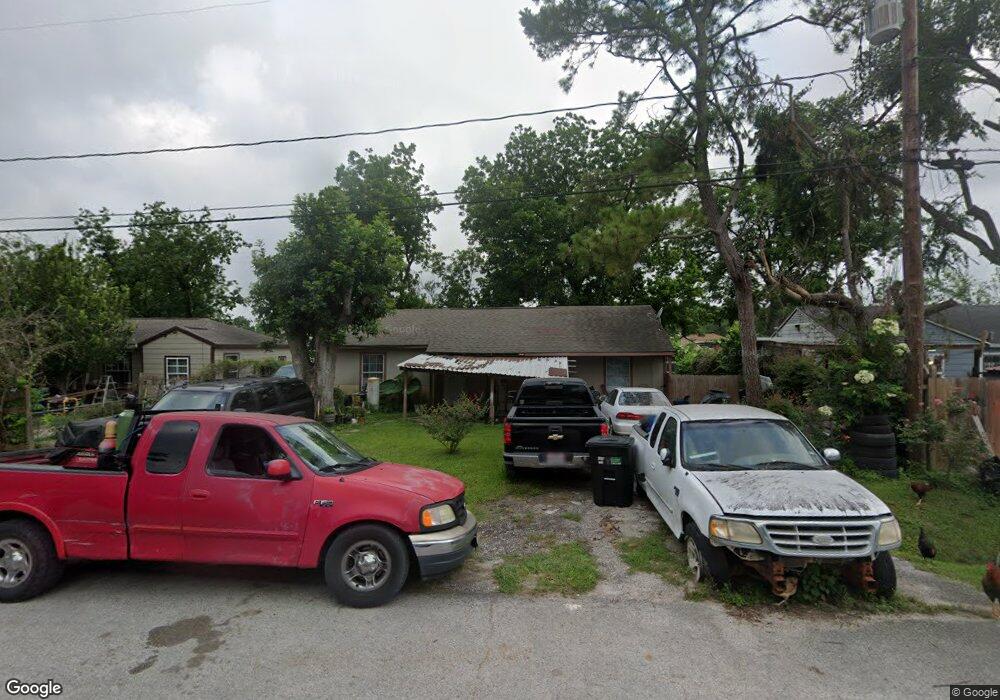
12907 Breezeway St Houston, TX 77037
Estimated Value: $126,856 - $167,000
3
Beds
1
Bath
1,142
Sq Ft
$130/Sq Ft
Est. Value
About This Home
This home is located at 12907 Breezeway St, Houston, TX 77037 and is currently estimated at $148,964, approximately $130 per square foot. 12907 Breezeway St is a home located in Harris County with nearby schools including Hinojosa EC/PK/K, Raymond Academy, and Grantham Academy.
Ownership History
Date
Name
Owned For
Owner Type
Purchase Details
Closed on
Nov 27, 2018
Sold by
Martinez Guerrero Jesus Antonio and Martinez Trejo Bricia
Bought by
Martinez Trejo Jesus Noel Huerrero and Martinez Guerrero Maria Del Rosario
Current Estimated Value
Purchase Details
Closed on
Apr 10, 2003
Sold by
Monjaraz Fausta T and Monjaraz Pedro
Bought by
Martinez Guerrero Jesus Antonio and Martinez Trejo Bricia
Home Financials for this Owner
Home Financials are based on the most recent Mortgage that was taken out on this home.
Original Mortgage
$65,000
Interest Rate
5.64%
Purchase Details
Closed on
Aug 28, 2002
Sold by
Huber Becky A
Bought by
Monjaraz Fausta T
Purchase Details
Closed on
Apr 24, 2000
Sold by
Daut Nellie Violet Burton
Bought by
Huber Becky A
Home Financials for this Owner
Home Financials are based on the most recent Mortgage that was taken out on this home.
Original Mortgage
$25,500
Interest Rate
8.14%
Create a Home Valuation Report for This Property
The Home Valuation Report is an in-depth analysis detailing your home's value as well as a comparison with similar homes in the area
Home Values in the Area
Average Home Value in this Area
Purchase History
| Date | Buyer | Sale Price | Title Company |
|---|---|---|---|
| Martinez Trejo Jesus Noel Huerrero | -- | None Available | |
| Martinez Guerrero Jesus Antonio | -- | Chicago Title | |
| Monjaraz Fausta T | -- | -- | |
| Huber Becky A | -- | -- |
Source: Public Records
Mortgage History
| Date | Status | Borrower | Loan Amount |
|---|---|---|---|
| Previous Owner | Martinez Guerrero Jesus Antonio | $65,000 | |
| Previous Owner | Huber Becky A | $25,500 |
Source: Public Records
Tax History Compared to Growth
Tax History
| Year | Tax Paid | Tax Assessment Tax Assessment Total Assessment is a certain percentage of the fair market value that is determined by local assessors to be the total taxable value of land and additions on the property. | Land | Improvement |
|---|---|---|---|---|
| 2025 | $814 | $42,089 | $6,188 | $35,901 |
| 2024 | $814 | $42,089 | $6,188 | $35,901 |
| 2023 | $814 | $42,089 | $6,188 | $35,901 |
| 2022 | $722 | $35,263 | $5,879 | $29,384 |
| 2021 | $759 | $35,263 | $5,755 | $29,508 |
| 2020 | $801 | $35,263 | $5,755 | $29,508 |
| 2019 | $839 | $35,263 | $5,755 | $29,508 |
| 2018 | $301 | $20,974 | $6,188 | $14,786 |
| 2017 | $544 | $24,000 | $6,188 | $17,812 |
| 2016 | $544 | $24,000 | $6,188 | $17,812 |
| 2015 | $535 | $24,000 | $6,188 | $17,812 |
| 2014 | $535 | $24,000 | $6,188 | $17,812 |
Source: Public Records
Map
Nearby Homes
- 931 Mitchell Rd
- 1122 Havner Ln
- 12806 Bauman Rd
- 511 Gulf Bank Rd Unit 5
- 13610 Carmilenda St
- 904 Hill Rd
- 8605 Airline Dr
- 12969 W Hardy Rd
- 1450 Mesquite St
- 1449 Mesquite St
- 12002 Privada Saratoga Ave
- 130 Airway Dr
- 7713 Airline Dr
- 28351 W Hardy Rd
- 11110 E Hardy Rd
- 822 Aldine Mail Route Rd
- 382 Airway St
- 1508 Hopper Rd Unit 1
- 8011 Werner St
- 13819 Stoneshire St
- 12909 Breezeway St
- 12905 Breezeway St
- 12911 Breezeway St
- 12901 Breezeway St
- 12904 Breezeway St
- 12915 Breezeway St
- 12902 Breezeway St
- 12914 Breezeway St
- 12914 Glenda St
- 12906 Glenda St
- 12918 Breezeway St
- 13001 Breezeway St
- 12916 Glenda St
- 13005 Breezeway St
- 12922 Glenda St
- 13004 Breezeway St
- 935 Castledale Dr
- 13009 Breezeway St
- 12911 Glenda St
- 13006 Glenda St