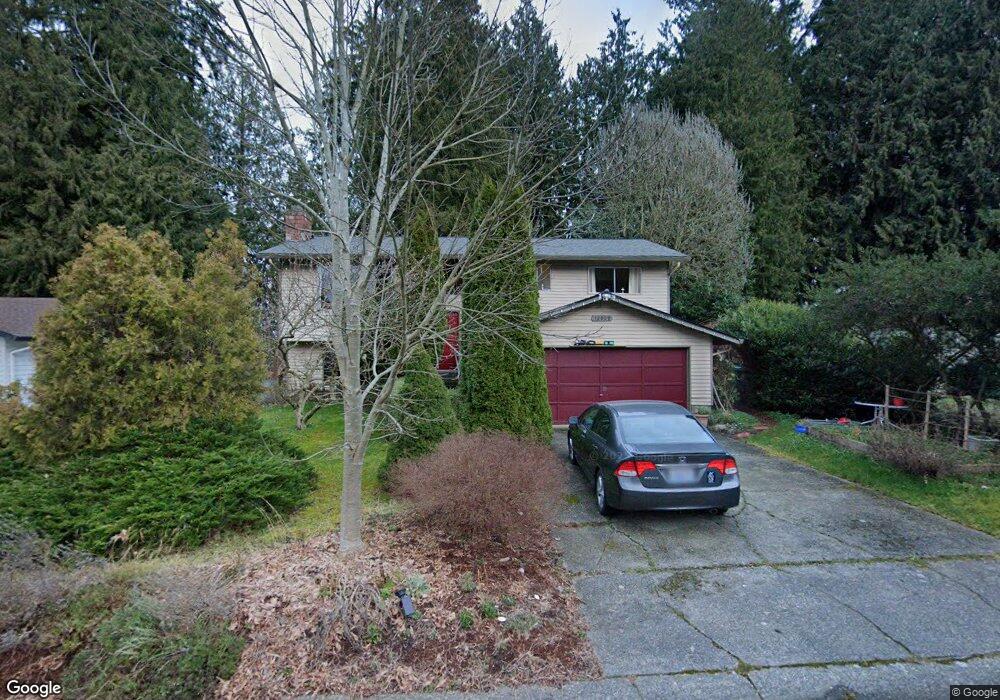
12909 55th Ave SE Everett, WA 98208
Estimated Value: $625,305 - $750,000
4
Beds
2
Baths
1,824
Sq Ft
$386/Sq Ft
Est. Value
About This Home
This home is located at 12909 55th Ave SE, Everett, WA 98208 and is currently estimated at $704,576, approximately $386 per square foot. 12909 55th Ave SE is a home located in Snohomish County with nearby schools including Little Cedars Elementary School, Valley View Middle School, and Glacier Peak High School.
Ownership History
Date
Name
Owned For
Owner Type
Purchase Details
Closed on
Jan 27, 2023
Sold by
Ferenczy Peter and Ferenczy Krisztina
Bought by
Peter Ferenczy And Krisztina Herendi Trust and Ferenczy
Current Estimated Value
Purchase Details
Closed on
Aug 26, 1996
Sold by
Hud
Bought by
Ferenczy Peter and Herendi Krisztina
Home Financials for this Owner
Home Financials are based on the most recent Mortgage that was taken out on this home.
Original Mortgage
$109,600
Interest Rate
8.2%
Purchase Details
Closed on
May 1, 1996
Sold by
Fleet Real Estate Funding Corp
Bought by
Hud
Purchase Details
Closed on
Nov 7, 1995
Sold by
Fredriksen Alan E and Fredriksen Jayne E
Bought by
Fleet Real Estate Funding Corp
Home Financials for this Owner
Home Financials are based on the most recent Mortgage that was taken out on this home.
Original Mortgage
$134,260
Interest Rate
7.62%
Mortgage Type
Seller Take Back
Create a Home Valuation Report for This Property
The Home Valuation Report is an in-depth analysis detailing your home's value as well as a comparison with similar homes in the area
Purchase History
| Date | Buyer | Sale Price | Title Company |
|---|---|---|---|
| Peter Ferenczy And Krisztina Herendi Trust | $313 | None Listed On Document | |
| Ferenczy Peter | -- | -- | |
| Hud | -- | Chicago Title Ins Co | |
| Fleet Real Estate Funding Corp | $145,503 | Chicago Title Ins Co |
Source: Public Records
Mortgage History
| Date | Status | Borrower | Loan Amount |
|---|---|---|---|
| Previous Owner | Ferenczy Peter | $109,600 | |
| Previous Owner | Fleet Real Estate Funding Corp | $134,260 |
Source: Public Records
Tax History
| Year | Tax Paid | Tax Assessment Tax Assessment Total Assessment is a certain percentage of the fair market value that is determined by local assessors to be the total taxable value of land and additions on the property. | Land | Improvement |
|---|---|---|---|---|
| 2025 | $4,754 | $617,500 | $425,000 | $192,500 |
| 2024 | $4,754 | $488,500 | $380,000 | $108,500 |
| 2023 | $5,354 | $599,900 | $485,000 | $114,900 |
| 2022 | $4,401 | $396,200 | $299,000 | $97,200 |
| 2020 | $4,063 | $333,700 | $240,000 | $93,700 |
| 2019 | $3,729 | $300,200 | $210,000 | $90,200 |
| 2018 | $4,021 | $272,600 | $190,000 | $82,600 |
| 2017 | $3,316 | $227,900 | $155,000 | $72,900 |
| 2016 | $3,084 | $203,900 | $134,000 | $69,900 |
Source: Public Records
Map
Nearby Homes
- 12826 53rd Dr SE
- 12325 55th Dr SE
- 12230 58th Ave SE
- 13631 55th Dr SE
- 12213 53rd Ave SE
- 13520 51st Dr SE
- 5912 121st St SE
- 5923 121st St SE
- 5032 122nd St SE
- 12909 67th Ave SE
- 5729 119th St SE
- 6707 126th St SE
- 6515 134th Place SE Unit C4
- 11802 58th Ave SE
- 13405 45th Dr SE Unit 3
- 12506 68th Ave SE
- 14116 60th Ave SE
- 11629 54th Dr SE
- 14302 57th Dr SE
- 11612 62nd Ave SE
- 12903 55th Ave SE
- 12917 55th Ave SE
- 12912 58th Ave SE
- 12904 58th Ave SE
- 12925 55th Ave SE
- 12827 55th Ave SE
- 12920 58th Ave SE
- 12912 55th Ave SE
- 12904 55th Ave SE
- 12830 58th Ave SE
- 12929 55th Ave SE
- 5618 128th Place SE
- 12926 58th Ave SE
- 5525 129th Place SE
- 12930 55th Ave SE
- 12824 58th Ave SE
- 12917 58th Ave SE
- 13003 55th Ave SE
- 5520 128th Place SE
- 12831 58th Ave SE
Your Personal Tour Guide
Ask me questions while you tour the home.