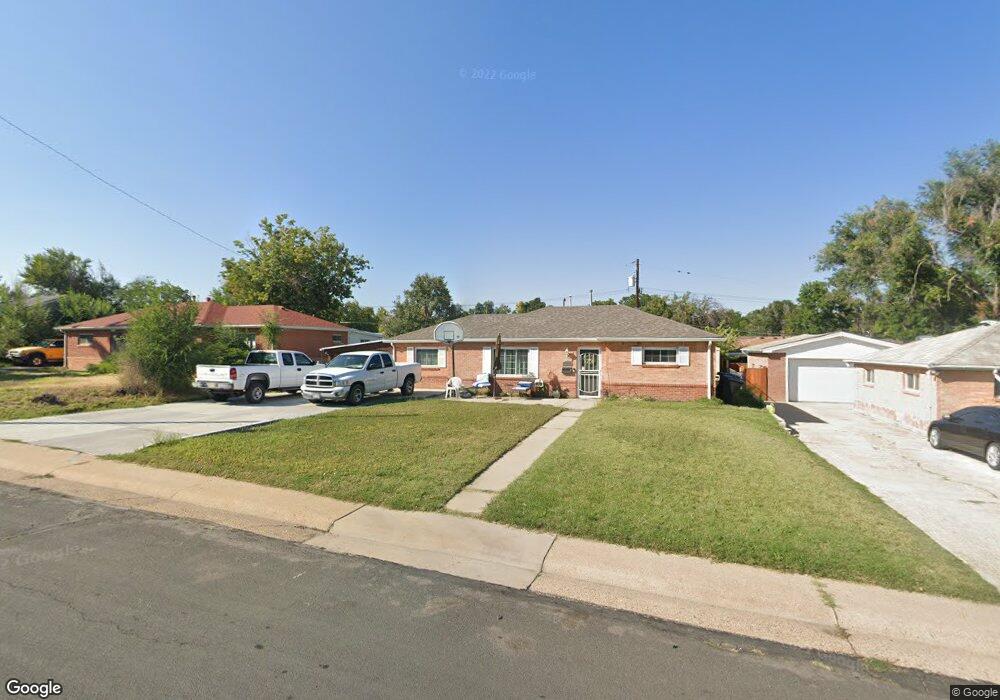
1291 Ash Ct Thornton, CO 80229
South Thornton NeighborhoodEstimated Value: $364,257 - $422,000
3
Beds
2
Baths
1,130
Sq Ft
$356/Sq Ft
Est. Value
About This Home
This home is located at 1291 Ash Ct, Thornton, CO 80229 and is currently estimated at $401,814, approximately $355 per square foot. 1291 Ash Ct is a home located in Adams County with nearby schools including McElwain Elementary School, Thornton Middle School, and Thornton High School.
Ownership History
Date
Name
Owned For
Owner Type
Purchase Details
Closed on
Sep 13, 2013
Sold by
Community Resources & Housing Developmen
Bought by
Collins Seth
Current Estimated Value
Home Financials for this Owner
Home Financials are based on the most recent Mortgage that was taken out on this home.
Original Mortgage
$105,500
Outstanding Balance
$78,914
Interest Rate
4.46%
Mortgage Type
New Conventional
Estimated Equity
$322,900
Purchase Details
Closed on
Mar 28, 2012
Sold by
U S Bank National Association
Bought by
Community Resources & Housing Developmen
Purchase Details
Closed on
Dec 13, 2011
Sold by
Diaz Santistevan Kathy and Santistevan Jose
Bought by
U S Bank National Association
Purchase Details
Closed on
Jun 28, 2001
Sold by
Simons Kenneth K and Simons Shirley Shirley
Bought by
Santistevan Jose and Diaz Santistevan Kathy
Home Financials for this Owner
Home Financials are based on the most recent Mortgage that was taken out on this home.
Original Mortgage
$146,924
Interest Rate
7.16%
Mortgage Type
FHA
Purchase Details
Closed on
Apr 6, 1993
Create a Home Valuation Report for This Property
The Home Valuation Report is an in-depth analysis detailing your home's value as well as a comparison with similar homes in the area
Home Values in the Area
Average Home Value in this Area
Purchase History
| Date | Buyer | Sale Price | Title Company |
|---|---|---|---|
| Collins Seth | $145,000 | None Available | |
| Community Resources & Housing Developmen | $65,000 | Fidelity National Title Insu | |
| U S Bank National Association | -- | None Available | |
| Santistevan Jose | $149,000 | -- | |
| -- | $55,300 | -- |
Source: Public Records
Mortgage History
| Date | Status | Borrower | Loan Amount |
|---|---|---|---|
| Open | Collins Seth | $105,500 | |
| Previous Owner | Santistevan Jose | $146,924 |
Source: Public Records
Tax History Compared to Growth
Tax History
| Year | Tax Paid | Tax Assessment Tax Assessment Total Assessment is a certain percentage of the fair market value that is determined by local assessors to be the total taxable value of land and additions on the property. | Land | Improvement |
|---|---|---|---|---|
| 2024 | $2,599 | $24,690 | $5,630 | $19,060 |
| 2023 | $2,572 | $28,820 | $6,090 | $22,730 |
| 2022 | $2,409 | $21,160 | $5,280 | $15,880 |
| 2021 | $2,409 | $21,160 | $5,280 | $15,880 |
| 2020 | $2,300 | $20,620 | $5,430 | $15,190 |
| 2019 | $2,305 | $20,620 | $5,430 | $15,190 |
| 2018 | $1,847 | $16,050 | $5,180 | $10,870 |
| 2017 | $1,679 | $16,050 | $5,180 | $10,870 |
| 2016 | $1,281 | $11,920 | $2,550 | $9,370 |
| 2015 | $1,279 | $11,920 | $2,550 | $9,370 |
| 2014 | -- | $10,000 | $1,990 | $8,010 |
Source: Public Records
Map
Nearby Homes
- 1290 Ash Ct
- 1050 Ash Ct
- 1010 Ash Ct
- 1490 Oak Place
- 991 Oak Place
- 8861 Poze Blvd
- 8770 Corona St Unit 304
- 9121 Lilly Ct
- 9171 Fir Dr
- 8731 Dawson St Unit 301
- 1250 Eppinger Blvd
- 400 Russell Blvd
- 9270 Fir Dr
- 8681 Hopkins Dr
- 1081 Dawson Dr
- 2081 E 88th Ave
- 8551 Faraday St
- 8960 Vine St
- 2141 E 88th Ave
- 8511 Franklin Dr