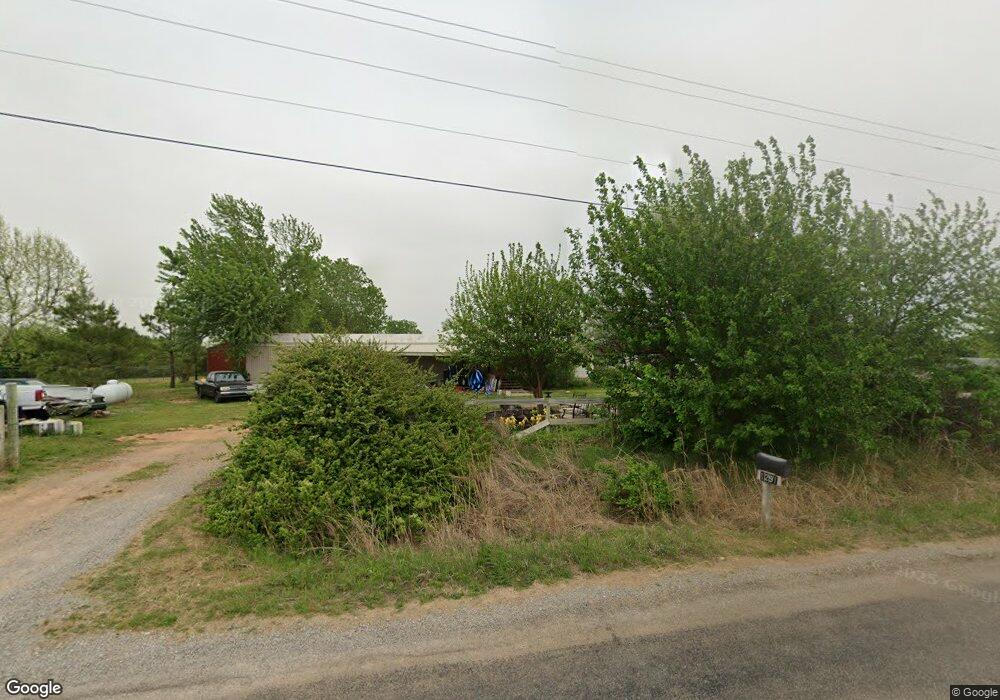
1291 County Street 2948 Tuttle, OK 73089
Bridge Creek NeighborhoodEstimated Value: $162,000 - $185,000
2
Beds
2
Baths
960
Sq Ft
$181/Sq Ft
Est. Value
About This Home
This home is located at 1291 County Street 2948, Tuttle, OK 73089 and is currently estimated at $173,797, approximately $181 per square foot. 1291 County Street 2948 is a home with nearby schools including Bridge Creek Elementary School, Bridge Creek Middle School, and Bridge Creek High School.
Ownership History
Date
Name
Owned For
Owner Type
Purchase Details
Closed on
Jun 30, 2025
Sold by
Jym Investments Llc
Bought by
Lowe Trae and Lowe Bethany
Current Estimated Value
Home Financials for this Owner
Home Financials are based on the most recent Mortgage that was taken out on this home.
Original Mortgage
$186,858
Outstanding Balance
$186,542
Interest Rate
6.85%
Mortgage Type
New Conventional
Estimated Equity
-$12,745
Purchase Details
Closed on
Aug 4, 2006
Sold by
Collins Michael L and Collins Sherri
Bought by
Brace Curtis D and Brace Misty R
Home Financials for this Owner
Home Financials are based on the most recent Mortgage that was taken out on this home.
Original Mortgage
$41,310
Interest Rate
6.78%
Mortgage Type
New Conventional
Purchase Details
Closed on
Feb 28, 2003
Sold by
Housley Gary M
Bought by
Collins Michael L
Create a Home Valuation Report for This Property
The Home Valuation Report is an in-depth analysis detailing your home's value as well as a comparison with similar homes in the area
Home Values in the Area
Average Home Value in this Area
Purchase History
| Date | Buyer | Sale Price | Title Company |
|---|---|---|---|
| Lowe Trae | $185,000 | Chicago Title | |
| Lowe Trae | $185,000 | Chicago Title | |
| Brace Curtis D | $46,000 | None Available | |
| Collins Michael L | $16,500 | -- |
Source: Public Records
Mortgage History
| Date | Status | Borrower | Loan Amount |
|---|---|---|---|
| Open | Lowe Trae | $186,858 | |
| Closed | Lowe Trae | $186,858 | |
| Previous Owner | Brace Curtis D | $41,310 |
Source: Public Records
Tax History Compared to Growth
Tax History
| Year | Tax Paid | Tax Assessment Tax Assessment Total Assessment is a certain percentage of the fair market value that is determined by local assessors to be the total taxable value of land and additions on the property. | Land | Improvement |
|---|---|---|---|---|
| 2025 | $851 | $8,025 | $2,510 | $5,515 |
| 2024 | $851 | $7,643 | $2,390 | $5,253 |
| 2023 | $851 | $7,279 | $3,259 | $4,020 |
| 2022 | $773 | $6,932 | $3,105 | $3,827 |
| 2021 | $633 | $6,602 | $1,906 | $4,696 |
| 2020 | $746 | $7,542 | $1,291 | $6,251 |
| 2019 | $719 | $7,322 | $1,291 | $6,031 |
| 2018 | $384 | $4,335 | $1,291 | $3,044 |
| 2017 | $385 | $4,478 | $1,291 | $3,187 |
| 2016 | $429 | $4,841 | $1,291 | $3,550 |
| 2015 | $336 | $4,720 | $1,291 | $3,429 |
| 2014 | $336 | $4,019 | $1,815 | $2,204 |
Source: Public Records
Map
Nearby Homes
- 2280 County Road 1245
- 1284 County Street 2953
- 0 Parcel Has No Street Name Unit 1192951
- 2141 County Road 1247
- 1215 County Street 2953 St
- 0 County Street 2953 Unit 1187811
- 2086 County Road 1239
- 1194 County Street 2955 St
- 1186 County Street 2954
- 1072 County Street 2958
- 1010 Prairie Rd
- 1018 Prairie Rd
- 1020 Prairie Rd
- 1022 Prairie Rd
- 1014 Prairie Rd
- 1016 Prairie Rd
- 1330 County Street 2927
- 1201 Layla Ln
- 1441 County Street 2964
- 2187 County Road 1268
- 2093 County Road 1249
- 2062 County Road 1250
- 2068 County Road 1250
- 1279 County Street 2948
- 2090 County Road 1249
- 2074 County Road 1250
- 2087 County Road 1247
- 2091 County Road 1247
- 2072 County Road 1250
- 1298 County Street 2950
- 2086 County Road 1247
- 2095 County Road 1247
- 2092 County Road 1247
- 2101 County Road 1247
- 2102 County Road 1249
- 2105 County Road 1247
- 2100 County Road 1247
- 2115 County Road 1249
- 1253 County Street 2948