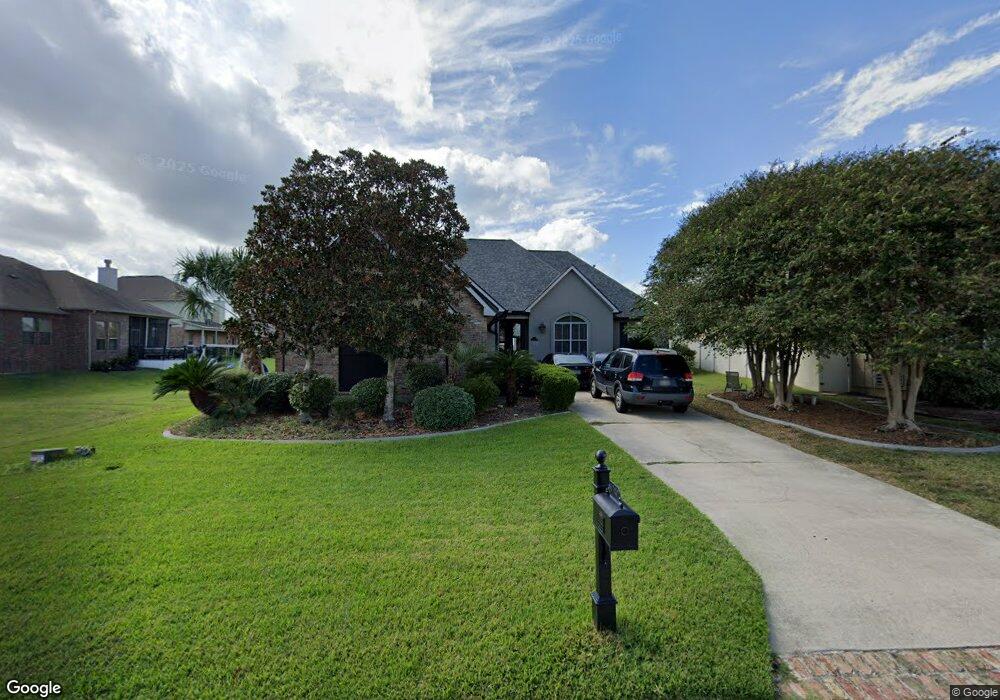
1291 Cutter Cove Slidell, LA 70458
Estimated Value: $476,693 - $582,000
4
Beds
3
Baths
2,957
Sq Ft
$182/Sq Ft
Est. Value
About This Home
This home is located at 1291 Cutter Cove, Slidell, LA 70458 and is currently estimated at $537,673, approximately $181 per square foot. 1291 Cutter Cove is a home located in St. Tammany Parish with nearby schools including W.L. Abney Elementary School, St. Tammany Junior High School, and Salmen High School.
Ownership History
Date
Name
Owned For
Owner Type
Purchase Details
Closed on
Nov 21, 2019
Sold by
Niolet Irina Raskina and Nicolet Jeffrey Michael
Bought by
Vinnett Dwayne J
Current Estimated Value
Home Financials for this Owner
Home Financials are based on the most recent Mortgage that was taken out on this home.
Original Mortgage
$435,000
Outstanding Balance
$383,824
Interest Rate
3.75%
Mortgage Type
VA
Estimated Equity
$153,849
Purchase Details
Closed on
Sep 27, 2013
Sold by
Prestige Realty Of Louisiana Llc
Bought by
Niolet Irina Raskina and Niolet Jeffrey M
Purchase Details
Closed on
Jun 13, 2008
Sold by
Deckert Mark David and Harris Lisa S
Bought by
Raskina Irina and Raskina Irina Iunusob
Home Financials for this Owner
Home Financials are based on the most recent Mortgage that was taken out on this home.
Original Mortgage
$336,000
Interest Rate
6.05%
Mortgage Type
New Conventional
Create a Home Valuation Report for This Property
The Home Valuation Report is an in-depth analysis detailing your home's value as well as a comparison with similar homes in the area
Home Values in the Area
Average Home Value in this Area
Purchase History
| Date | Buyer | Sale Price | Title Company |
|---|---|---|---|
| Vinnett Dwayne J | $435,000 | None Available | |
| Niolet Irina Raskina | $1,000 | None Available | |
| Raskina Irina | $420,000 | Advance Title Llc |
Source: Public Records
Mortgage History
| Date | Status | Borrower | Loan Amount |
|---|---|---|---|
| Open | Vinnett Dwayne J | $435,000 | |
| Previous Owner | Raskina Irina | $336,000 |
Source: Public Records
Tax History Compared to Growth
Tax History
| Year | Tax Paid | Tax Assessment Tax Assessment Total Assessment is a certain percentage of the fair market value that is determined by local assessors to be the total taxable value of land and additions on the property. | Land | Improvement |
|---|---|---|---|---|
| 2024 | $39 | $45,310 | $5,000 | $40,310 |
| 2023 | $39 | $36,490 | $5,000 | $31,490 |
| 2022 | $314,776 | $36,490 | $5,000 | $31,490 |
| 2021 | $3,143 | $36,490 | $5,000 | $31,490 |
| 2020 | $5,283 | $36,490 | $5,000 | $31,490 |
| 2019 | $5,411 | $36,019 | $5,000 | $31,019 |
| 2018 | $5,431 | $36,019 | $5,000 | $31,019 |
| 2017 | $5,467 | $36,019 | $5,000 | $31,019 |
| 2016 | $5,594 | $36,019 | $5,000 | $31,019 |
| 2015 | $5,626 | $35,218 | $7,000 | $28,218 |
| 2014 | $5,518 | $35,218 | $7,000 | $28,218 |
| 2013 | -- | $35,218 | $7,000 | $28,218 |
Source: Public Records
Map
Nearby Homes
- 0 Cutter Cove
- 1286 Cutter Cove
- 1299 Cutter Cove
- 1410 Royal Palm Dr
- 1424 Royal Palm Dr
- 1322 Cutter Cove
- 1565 Regatta Cove
- 1185 Clipper Dr
- 1456 Royal Palm Dr
- 1454 Royal Palm Dr
- 1545 Cuttysark Cove
- 1613 Cuttysark Cove
- 1609 Cuttysark Cove
- 110 Southern Star
- 100 Southern Star
- Lot 551 Moonraker Dr
- 111 Valiant Ln
- 1291 Cutter Cove
- 1295 Cutter Cove
- 1275 Cutter Cove None
- 1504 Regatta Cove
- 0 Cutter Cove St
- 0 Cutter Cove Dr
- 0 Cutter Cove Cove
- 0 Cutter Cove None Unit 742920
- 0 Cutter Cove None Unit 766554
- 0 Cutter Cove None Unit 810654
- 0 Cutter Cove None Unit 855230
- 1508 Regatta Cove
- 1512 Regatta Cove
- 1512 Regatta Cove Other
- 1501 Cuttysark Cove
- 999 Regatta Cove Other
- 1516 Regatta Cove
- 1501 Regatta Cove
- 156 Cutty Sark Cove
- 156 Cutty Sark Cove None