1291 E Ludlow Ridge Rd Port Ludlow, WA 98365
Port Ludlow NeighborhoodEstimated payment $10,778/month
Highlights
- 3.38 Acre Lot
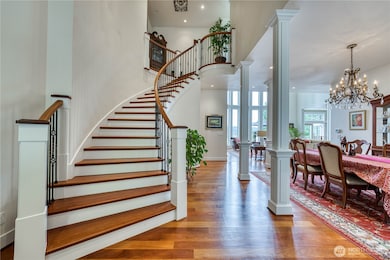
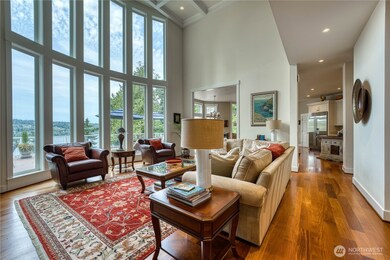
- Vaulted Ceiling
- 2 Fireplaces
- Property is near public transit
- Modern Architecture
- Walk-In Pantry
About This Home
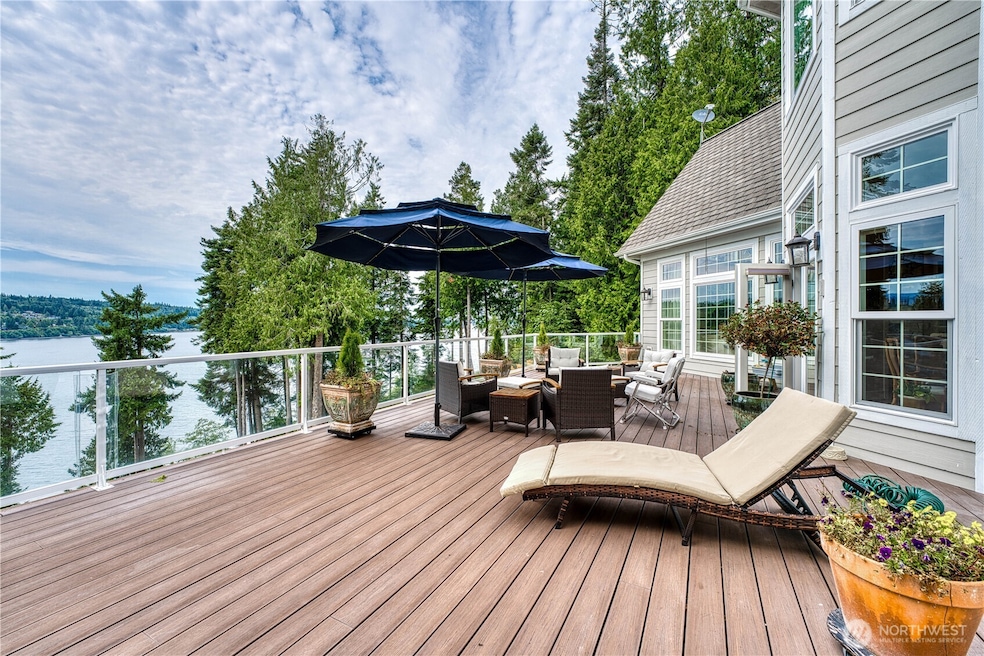
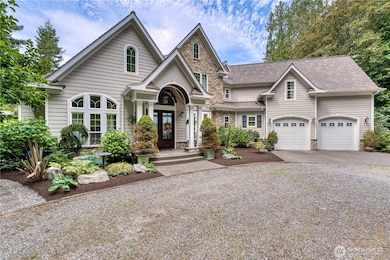
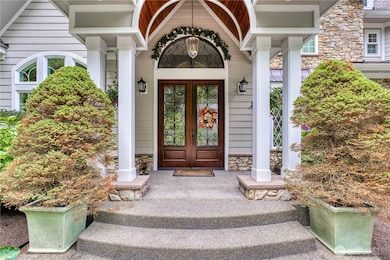
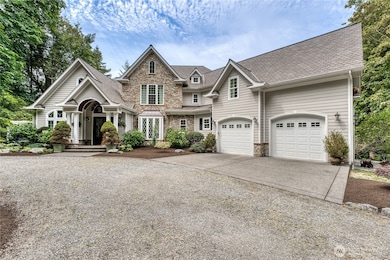
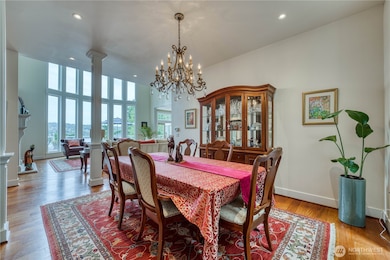
Stunning luxury home with majestic views of Port Ludlow Bay! Thoughtfully limbed cedar and maple trees reveal sweeping vistas from this serene medium-bank waterfront setting. The spacious primary suite on the main floor offers direct access to a private jacuzzi—perfect for soaking in the views. Designed for comfort and elegance, the home features an open layout and refined coastal finishes. An unfinished basement with garage door access offers versatile space for a workshop, a small boat, or an extra vehicle. Gated entries to both Tala Point Estates and the property, plus a grand tree-lined driveway, complete this exceptional retreat. Freshly added driveway rock surrounded my meticulously designed landscape throughout the property.

Source: Northwest Multiple Listing Service (NWMLS)
MLS#: 2415023
Property Details
Home Type
- Co-Op
Est. Annual Taxes
- $12,450
Year Built
- Built in 2012
Lot Details
- 3.38 Acre Lot
- East Facing Home
- Property is in very good condition
HOA Fees
- $42 Monthly HOA Fees
Parking
- 4 Car Attached Garage
- Driveway
- Off-Street Parking
Home Design
- Modern Architecture
- Poured Concrete
- Composition Roof
- Stone Siding
- Cement Board or Planked
- Stone
Interior Spaces
- 4,466 Sq Ft Home
- 2-Story Property
- Central Vacuum
- Vaulted Ceiling
- Skylights
- 2 Fireplaces
- French Doors
- Dining Room
- Storm Windows
- Walk-In Pantry
- Rough-In Basement
Bedrooms and Bathrooms
- Walk-In Closet
- Bathroom on Main Level
- Soaking Tub
- Spa Bath
Location
- Property is near public transit
- Property is near a bus stop
Utilities
- Central Air
- Heat Pump System
- Generator Hookup
- Propane
- Shared Well
- Hot Water Circulator
- Water Heater
- Septic Tank
Community Details
- Association fees include road maintenance, snow removal
- Tala Point Home Owners Association
- Secondary HOA Phone (815) 383-0657
- Tala Shores Subdivision
Listing and Financial Details
- Assessor Parcel Number 821103013
Map
Home Values in the Area
Average Home Value in this Area
Tax History
| Year | Tax Paid | Tax Assessment Tax Assessment Total Assessment is a certain percentage of the fair market value that is determined by local assessors to be the total taxable value of land and additions on the property. | Land | Improvement |
|---|---|---|---|---|
| 2024 | $11,670 | $1,557,636 | $409,500 | $1,148,136 |
| 2023 | $11,670 | $1,480,948 | $385,000 | $1,095,948 |
| 2022 | $12,700 | $1,475,948 | $380,000 | $1,095,948 |
| 2021 | $12,475 | $1,393,428 | $356,250 | $1,037,178 |
| 2020 | $11,993 | $1,288,100 | $327,750 | $960,350 |
| 2019 | $11,385 | $1,197,022 | $313,500 | $883,522 |
| 2018 | $11,845 | $1,144,358 | $299,250 | $845,108 |
| 2017 | $11,553 | $1,053,280 | $285,000 | $768,280 |
| 2016 | $13,440 | $1,053,280 | $285,000 | $768,280 |
| 2015 | $13,266 | $1,205,522 | $322,000 | $883,522 |
| 2014 | -- | $1,205,522 | $322,000 | $883,522 |
| 2013 | -- | $1,093,280 | $325,000 | $768,280 |
Property History
| Date | Event | Price | List to Sale | Price per Sq Ft |
|---|---|---|---|---|
| 10/09/2025 10/09/25 | Price Changed | $1,840,000 | -2.6% | $412 / Sq Ft |
| 09/28/2025 09/28/25 | Price Changed | $1,890,000 | -5.5% | $423 / Sq Ft |
| 09/08/2025 09/08/25 | Price Changed | $1,999,000 | -7.0% | $448 / Sq Ft |
| 08/08/2025 08/08/25 | For Sale | $2,150,000 | -- | $481 / Sq Ft |
Purchase History
| Date | Type | Sale Price | Title Company |
|---|---|---|---|
| Quit Claim Deed | $313 | None Listed On Document | |
| Personal Reps Deed | $313 | None Listed On Document | |
| Quit Claim Deed | $280 | None Available | |
| Warranty Deed | $362,500 | None Available |
Mortgage History
| Date | Status | Loan Amount | Loan Type |
|---|---|---|---|
| Previous Owner | $243,750 | Purchase Money Mortgage |
Source: Northwest Multiple Listing Service (NWMLS)
MLS Number: 2415023
APN: 821103013
Disclaimer: Certain information contained herein is derived from information provided by parties other than Homes.com. All information provided is deemed reliable, but is not guaranteed to be accurate and should be independently verified.
![]() All data is obtained from various sources and may not have been verified by broker or MLS GRID. Supplied Open House Information is subject to change without notice. All information should be independently reviewed and verified for accuracy. Properties may or may not be listed by the office/agent presenting the information. Listing information is provided by the Northwest Multiple Listing Service (NWMLS). Property information is based on available data that may include MLS information, county records, and other sources. Listings marked with the 3 tree icon and provided by NWMLS. All properties are subject to prior sale or withdrawal. IDX information is provided exclusively for consumers’ personal noncommercial use, that it may not be used for any purpose other than to identify prospective properties consumers may be interested in purchasing, that the data is deemed reliable but is not guaranteed by MLS GRID. ©2025 NWMLS.
All data is obtained from various sources and may not have been verified by broker or MLS GRID. Supplied Open House Information is subject to change without notice. All information should be independently reviewed and verified for accuracy. Properties may or may not be listed by the office/agent presenting the information. Listing information is provided by the Northwest Multiple Listing Service (NWMLS). Property information is based on available data that may include MLS information, county records, and other sources. Listings marked with the 3 tree icon and provided by NWMLS. All properties are subject to prior sale or withdrawal. IDX information is provided exclusively for consumers’ personal noncommercial use, that it may not be used for any purpose other than to identify prospective properties consumers may be interested in purchasing, that the data is deemed reliable but is not guaranteed by MLS GRID. ©2025 NWMLS.
Based on information submitted to the MLS GRID
- 0 xxx E Tala Shore Dr
- 140 Admiralty Ln Unit 370
- 140 Condon Ln
- Ponderosa Plan at Olympic Terrace
- Daniel Plan at Olympic Terrace
- 31 McCartney Peak Ln
- Decker Plan at Olympic Terrace
- 130 Baldwin Ln
- 155 Baldwin Ln
- 110 Cressey Ln
- 1 Pintail Rd
- 270 Puget Loop
- 23 Machias Loop
- 142 Resolute Ln
- 91 Drew Ln
- 37 Jackson Ln
- 40 Trader Ln
- 61 Olympic Ln
- 95 Martingale Place
- 73 Topside Ct
- 221 N Bay Ln Unit 2
- 10894 Rhody Dr
- 31 Colwell St
- 51 Colwell St
- 25105 Taka Ln NE Unit SuiteB
- 191 Airport Rd
- 3615 Britzman Loop
- 2800 NE Lindvog Rd
- 10811 NE State Highway 104
- 26260 Dungeness Ave NE
- 21056 Viking Ave NW
- 20455 1st Ave NE
- 20043 Winton Ln NW
- 19630 Ash Crest Loop NE
- 19660 10th Ave NE
- 19089 Jensen Way NE
- 5024 Saratoga Rd Unit Studio
- 2122 NE Hostmark St
- 4050 Hollyhock Ln
- 2500 9th St