1291 Front Ave Columbus, GA 31901
Uptown NeighborhoodAbout This Home
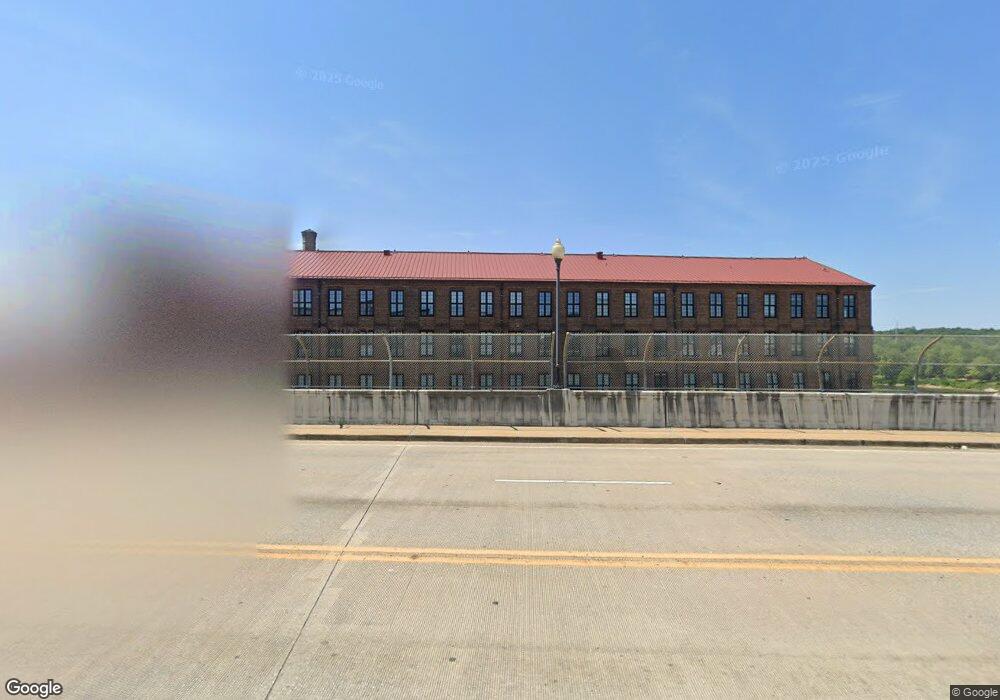
Eagle & Phenix Apartments offer a unique opportunity to live in one of Columbus’ most iconic and historic developments. Set along the Chattahoochee River in Uptown, this apartment community includes residences in the restored Mill No. 1, Mill No. 2, Admin Building, and Machine Shop—each offering distinct character and industrial charm.
Apartments feature exposed brick, original beams, high ceilings, and expansive windows that bring in natural light and river views. Modern finishes like granite countertops, stainless steel appliances, and in-unit laundry blend seamlessly with the historic architecture.
Residents enjoy secured access, a private fitness center, and direct access to the RiverWalk. With restaurants, shopping, and entertainment just steps away, Eagle & Phenix Apartments combine history, style, and unbeatable location.
Ownership History
Purchase Details
Home Values in the Area
Average Home Value in this Area
Purchase History
| Date | Buyer | Sale Price | Title Company |
|---|---|---|---|
| Wcb Residential Llc | -- | -- |
Property History
| Date | Event | Price | List to Sale | Price per Sq Ft |
|---|---|---|---|---|
| 10/04/2025 10/04/25 | Off Market | $1,175 | -- | -- |
| 05/13/2025 05/13/25 | Price Changed | $1,175 | -16.1% | $2 / Sq Ft |
| 04/23/2025 04/23/25 | Price Changed | $1,400 | +19.1% | $2 / Sq Ft |
| 04/22/2025 04/22/25 | For Rent | $1,175 | -- | -- |
Tax History
| Year | Tax Paid | Tax Assessment Tax Assessment Total Assessment is a certain percentage of the fair market value that is determined by local assessors to be the total taxable value of land and additions on the property. | Land | Improvement |
|---|---|---|---|---|
| 2025 | $90,288 | $2,010,644 | $219,384 | $1,791,260 |
| 2024 | $90,288 | $2,010,644 | $219,384 | $1,791,260 |
| 2023 | $90,783 | $2,010,644 | $219,384 | $1,791,260 |
| 2022 | $97,283 | $2,456,500 | $219,384 | $2,237,116 |
| 2021 | $97,502 | $2,092,724 | $219,384 | $1,873,340 |
| 2020 | $56,443 | $2,092,724 | $219,384 | $1,873,340 |
| 2019 | $15,406 | $2,092,724 | $219,384 | $1,873,340 |
| 2018 | $15,406 | $2,513,766 | $431,640 | $2,082,126 |
| 2017 | $15,449 | $2,513,766 | $431,640 | $2,082,126 |
| 2016 | $15,498 | $2,477,680 | $543,542 | $1,934,138 |
| 2015 | $15,514 | $2,477,680 | $543,542 | $1,934,138 |
| 2014 | $6,406 | $2,477,680 | $543,542 | $1,934,138 |
Map
- 1201 Front Ave Unit 522
- 1201 Front Ave Unit 304
- 1201 Front Ave Unit 507
- 1201 Front Ave Unit 203
- 1201 Front Ave Unit 222
- 1204 1st Ave Unit 303
- 304 11th St S
- Lots 1-8 3rd Ave
- 404 3rd Ave
- 917 7th Ave
- 1415 9th Ave
- 1813 6 Ct
- 1412 10th Ave
- 816 2nd Ave
- 1822 6th Ct
- 1005 11th St
- 731 Broadway
- 804 2nd Ave
- 811 3rd Ave
- 800 2nd Ave
- 1329 Front Ave
- 1339 Front Ave
- 1339 Front Ave
- 1201 Front Ave Unit 323
- 1201 Front Ave Unit 218
- 1201 Front Ave
- 1201 Front Ave Unit 315
- 1201 Front Ave Unit 319
- 1201 Front Ave Unit 215
- 1201 Front Ave Unit 408
- 1201 Front Ave Unit 307
- 1201 Front Ave Unit 213
- 1201 Front Ave Unit 201
- 1201 Front Ave Unit 308
- 1201 Front Ave Unit 205
- 1201 Front Ave Unit 219
- 1201 Front Ave Unit 318
- 1201 Front Ave Unit 508
- 1201 Front Ave Unit 322
- 1201 Front Ave Unit 312
Ask me questions while you tour the home.