1291 N Glen Cir Unit B Aurora, IL 60506
Edgelawn Randall NeighborhoodEstimated Value: $159,000 - $208,000
3
Beds
1
Bath
1,056
Sq Ft
$177/Sq Ft
Est. Value
About This Home
This home is located at 1291 N Glen Cir Unit B, Aurora, IL 60506 and is currently estimated at $187,203, approximately $177 per square foot. 1291 N Glen Cir Unit B is a home located in Kane County with nearby schools including Mccleery Elementary School, Jefferson Middle School, and West Aurora High School.
Ownership History
Date
Name
Owned For
Owner Type
Purchase Details
Closed on
Jun 24, 2005
Sold by
Sifuentes Juan
Bought by
Li Hongwei and Wang Yaqin
Current Estimated Value
Home Financials for this Owner
Home Financials are based on the most recent Mortgage that was taken out on this home.
Original Mortgage
$85,600
Outstanding Balance
$44,976
Interest Rate
5.86%
Mortgage Type
New Conventional
Estimated Equity
$142,227
Purchase Details
Closed on
Sep 6, 2002
Sold by
Sifuentes Juan and Garcia Isabel
Bought by
Sifuentes Juan
Home Financials for this Owner
Home Financials are based on the most recent Mortgage that was taken out on this home.
Original Mortgage
$70,975
Interest Rate
8.75%
Purchase Details
Closed on
May 18, 2000
Sold by
Lasourd Larry L
Bought by
Sifuentes Juan and Garcia Isabel
Home Financials for this Owner
Home Financials are based on the most recent Mortgage that was taken out on this home.
Original Mortgage
$58,550
Interest Rate
8.13%
Mortgage Type
FHA
Create a Home Valuation Report for This Property
The Home Valuation Report is an in-depth analysis detailing your home's value as well as a comparison with similar homes in the area
Home Values in the Area
Average Home Value in this Area
Purchase History
| Date | Buyer | Sale Price | Title Company |
|---|---|---|---|
| Li Hongwei | $107,000 | Residential Title Services | |
| Sifuentes Juan | -- | Residential Title Services | |
| Sifuentes Juan | $60,000 | -- |
Source: Public Records
Mortgage History
| Date | Status | Borrower | Loan Amount |
|---|---|---|---|
| Open | Li Hongwei | $85,600 | |
| Previous Owner | Sifuentes Juan | $70,975 | |
| Previous Owner | Sifuentes Juan | $58,550 |
Source: Public Records
Tax History Compared to Growth
Tax History
| Year | Tax Paid | Tax Assessment Tax Assessment Total Assessment is a certain percentage of the fair market value that is determined by local assessors to be the total taxable value of land and additions on the property. | Land | Improvement |
|---|---|---|---|---|
| 2024 | $2,825 | $35,681 | $2,650 | $33,031 |
| 2023 | $2,584 | $30,163 | $2,368 | $27,795 |
| 2022 | $2,436 | $27,521 | $2,161 | $25,360 |
| 2021 | $2,064 | $22,588 | $2,012 | $20,576 |
| 2020 | $1,964 | $20,981 | $1,869 | $19,112 |
| 2019 | $1,863 | $19,052 | $1,732 | $17,320 |
| 2018 | $1,734 | $17,370 | $1,602 | $15,768 |
| 2017 | $1,351 | $13,129 | $1,476 | $11,653 |
| 2016 | $1,144 | $10,769 | $1,265 | $9,504 |
| 2015 | -- | $9,981 | $1,088 | $8,893 |
| 2014 | -- | $8,924 | $1,080 | $7,844 |
| 2013 | -- | $8,527 | $1,032 | $7,495 |
Source: Public Records
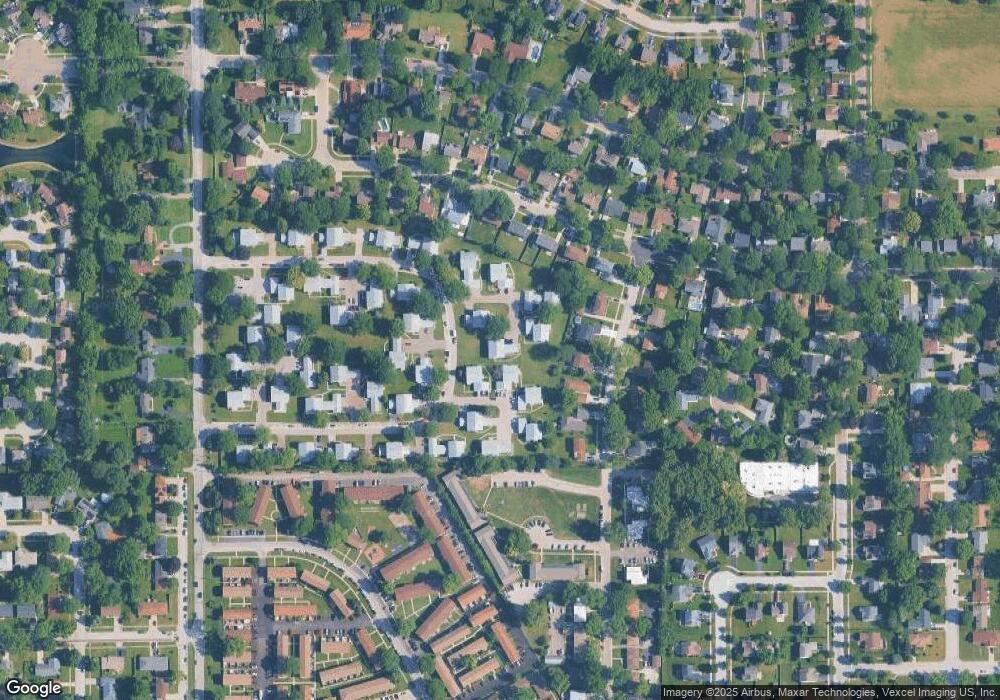
Map
Nearby Homes
- 1390 N Glen Cir Unit B
- 1351 Monomoy St Unit D
- 1389 Monomoy St Unit B2
- 833 N Randall Rd Unit C4
- 1296 Yellowpine Dr
- 1104 New Haven Ave
- 972 Westgate Dr
- 1035 Newcastle Ln
- 795 N Elmwood Dr
- 781 N Elmwood Dr
- 1149 Newcastle Ln
- 630 N Buell Ave
- 910 Southbridge Dr
- 616 Morton Ave
- 1747 W Illinois Ave
- 943 Charles St
- 1532 Golden Oaks Pkwy
- 960 Sapphire Ln
- 964 Sapphire Ln
- 967 Sapphire Ln
- 1291 N Glen Cir Unit C
- 1291 N Glen Cir Unit D
- 1291 N Glen Cir Unit 8A
- 1330 N Glen Cir Unit C
- 1330 N Glen Cir Unit D
- 1330 N Glen Cir Unit A
- 1330 N Glen Cir Unit B
- 1330 N Glen Cir Unit 15-A
- 1312 S Glen Cir Unit D
- 1312 S Glen Cir Unit B
- 1312 S Glen Cir Unit C
- 1312 S Glen Cir Unit A
- 1320 N Glen Cir Unit D
- 1320 N Glen Cir Unit C
- 1320 N Glen Cir Unit A
- 1302 S Glen Cir Unit A
- 1302 S Glen Cir Unit 3C
- 1302 S Glen Cir Unit B
- 1302 S Glen Cir Unit D
- 1302 S Glen Cir Unit C