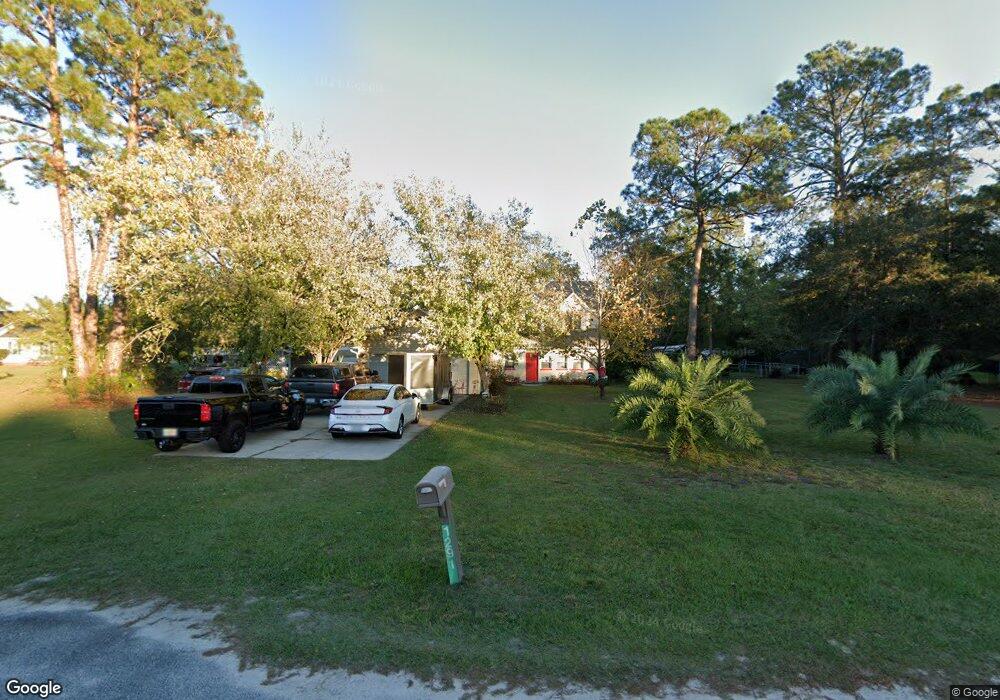
1291 Redfish Dr SE Darien, GA 31305
Estimated Value: $243,000 - $395,000
4
Beds
3
Baths
1,980
Sq Ft
$166/Sq Ft
Est. Value
About This Home
This home is located at 1291 Redfish Dr SE, Darien, GA 31305 and is currently estimated at $328,145, approximately $165 per square foot. 1291 Redfish Dr SE is a home located in McIntosh County with nearby schools including Todd Grant Elementary School, McIntosh County Middle School, and McIntosh County Academy.
Ownership History
Date
Name
Owned For
Owner Type
Purchase Details
Closed on
Feb 5, 2019
Sold by
Johnson Craig A
Bought by
Johnson Valerie A and Gordon Wanda D
Current Estimated Value
Home Financials for this Owner
Home Financials are based on the most recent Mortgage that was taken out on this home.
Original Mortgage
$97,600
Outstanding Balance
$62,507
Interest Rate
4.4%
Mortgage Type
New Conventional
Estimated Equity
$265,638
Purchase Details
Closed on
Oct 31, 2011
Sold by
Jacobson Calvin Bruce
Bought by
Johnson Craig A
Home Financials for this Owner
Home Financials are based on the most recent Mortgage that was taken out on this home.
Original Mortgage
$165,519
Interest Rate
4.09%
Mortgage Type
New Conventional
Purchase Details
Closed on
Nov 26, 1998
Sold by
Alford J W
Bought by
Jacobson Calvin Bruc
Purchase Details
Closed on
Oct 26, 1998
Sold by
Alford Mike
Bought by
Jacobson Calvin Bruc
Create a Home Valuation Report for This Property
The Home Valuation Report is an in-depth analysis detailing your home's value as well as a comparison with similar homes in the area
Home Values in the Area
Average Home Value in this Area
Purchase History
| Date | Buyer | Sale Price | Title Company |
|---|---|---|---|
| Johnson Valerie A | $122,000 | -- | |
| Johnson Craig A | $174,230 | -- | |
| Jacobson Calvin Bruc | -- | -- | |
| Jacobson Calvin Bruc | $141,500 | -- |
Source: Public Records
Mortgage History
| Date | Status | Borrower | Loan Amount |
|---|---|---|---|
| Open | Johnson Valerie A | $97,600 | |
| Previous Owner | Johnson Craig A | $165,519 |
Source: Public Records
Tax History Compared to Growth
Tax History
| Year | Tax Paid | Tax Assessment Tax Assessment Total Assessment is a certain percentage of the fair market value that is determined by local assessors to be the total taxable value of land and additions on the property. | Land | Improvement |
|---|---|---|---|---|
| 2024 | $3,147 | $107,932 | $8,600 | $99,332 |
| 2023 | $2,997 | $102,172 | $8,600 | $93,572 |
| 2022 | $2,644 | $89,504 | $8,600 | $80,904 |
| 2021 | $1,959 | $73,720 | $8,600 | $65,120 |
| 2020 | $88 | $71,328 | $8,600 | $62,728 |
| 2019 | $1,861 | $70,036 | $8,600 | $61,436 |
| 2018 | $1,861 | $70,036 | $8,600 | $61,436 |
| 2017 | $1,909 | $66,116 | $8,600 | $57,516 |
| 2016 | $1,909 | $66,116 | $8,600 | $57,516 |
| 2015 | $1,804 | $62,940 | $6,000 | $56,941 |
| 2014 | $1,807 | $62,941 | $6,000 | $56,941 |
Source: Public Records
Map
Nearby Homes
- 1616 Ashantilly Dr
- 1606 Ashantilly Dr
- 1613 Ashantilly Dr
- 1194 Redfish Dr SE
- 0 Franklin St Unit 142919
- 2079 Black Rd
- 0 Us Hwy 17 Unit 327199
- 0 Us Hwy 17 Unit 10476315
- 2211 Black Rd
- 1048 Austin Place
- 282 Bridgewater Ln
- Lot 71 Cottage Way
- 1086 Cottage Way
- Lot 70 Cottage Way
- 1044 Cottage Way
- 1345 Bay St
- 1602 Ashantilly Dr
- 1658 Ashantilly Dr
- 1681 Ashantilly Dr
- 1235 Redfish Dr SE
- 1286 Redfish Dr SE
- 1349 Redfish Dr
- 1272 Redfish Dr SE
- 1338 Redfish Dr
- 1250 Redfish Dr SE
- 1615 Ashantilly Dr
- 1647 Ashantilly Dr
- 1643 Ashantilly Dr
- 1666 Ashantilly Dr
- 1670 Ashantilly Dr
- 1668 Ashantilly Dr
- 1672 Ashantilly Dr
- 1660 Ashantilly Dr
- 1650 Ashantilly Dr
- 1667 Ashantilly Dr
- 1652 Ashantilly Dr
- 1619 Ashantilly Dr
- 1641 Ashantilly Dr
- 1751 Canal St SE