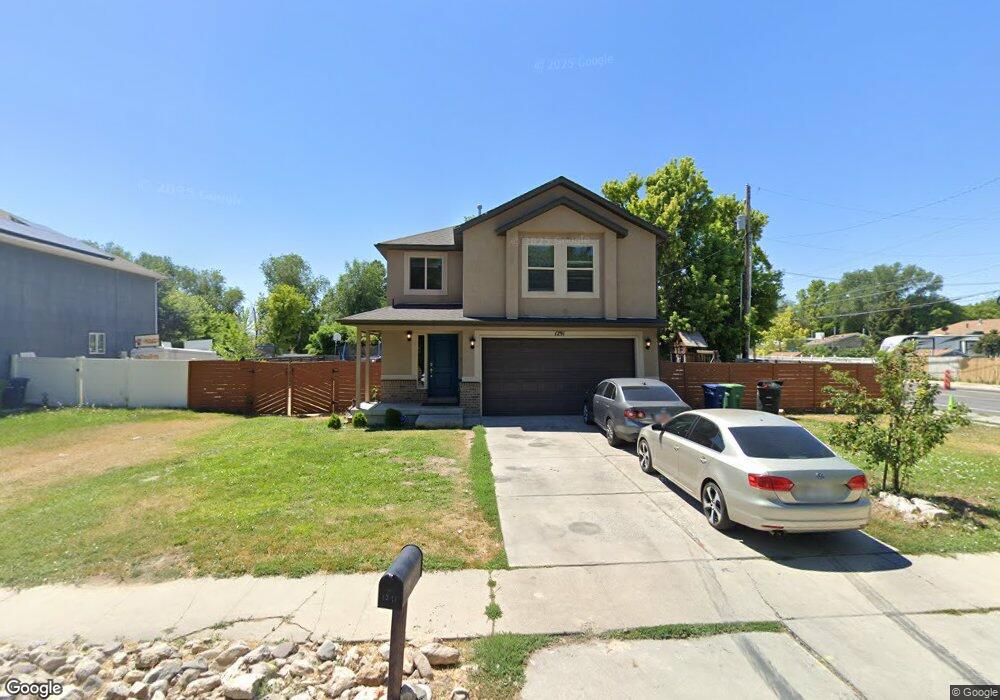
1291 W 7125 S West Jordan, UT 84084
Estimated Value: $496,000 - $593,000
3
Beds
3
Baths
2,247
Sq Ft
$247/Sq Ft
Est. Value
About This Home
This home is located at 1291 W 7125 S, West Jordan, UT 84084 and is currently estimated at $554,204, approximately $246 per square foot. 1291 W 7125 S is a home located in Salt Lake County with nearby schools including Heartland Elementary School, West Jordan Middle School, and West Jordan High School.
Ownership History
Date
Name
Owned For
Owner Type
Purchase Details
Closed on
Aug 3, 2020
Sold by
Macias Christopher A and Houguin Maciaas Diana
Bought by
Holguin Macias Diana Belem and Macias Christopher Alexander
Current Estimated Value
Home Financials for this Owner
Home Financials are based on the most recent Mortgage that was taken out on this home.
Original Mortgage
$336,000
Outstanding Balance
$298,606
Interest Rate
3.1%
Mortgage Type
New Conventional
Estimated Equity
$255,598
Purchase Details
Closed on
Aug 22, 2012
Sold by
Huckleberry Homes Inc
Bought by
Macias Christopher A and Holguin-Macias Diana B
Home Financials for this Owner
Home Financials are based on the most recent Mortgage that was taken out on this home.
Original Mortgage
$210,197
Interest Rate
3.53%
Mortgage Type
FHA
Purchase Details
Closed on
Apr 21, 2011
Sold by
Robison Matthew
Bought by
Huckleberry Homes Inc
Purchase Details
Closed on
Feb 18, 2009
Sold by
Robison Brent
Bought by
Robison Matthew
Create a Home Valuation Report for This Property
The Home Valuation Report is an in-depth analysis detailing your home's value as well as a comparison with similar homes in the area
Home Values in the Area
Average Home Value in this Area
Purchase History
| Date | Buyer | Sale Price | Title Company |
|---|---|---|---|
| Holguin Macias Diana Belem | -- | Cottonwood Title | |
| Macias Christopher A | -- | Meridian Title | |
| Huckleberry Homes Inc | -- | Accommodation | |
| Robison Matthew | -- | Accommodation |
Source: Public Records
Mortgage History
| Date | Status | Borrower | Loan Amount |
|---|---|---|---|
| Open | Holguin Macias Diana Belem | $336,000 | |
| Closed | Macias Christopher A | $210,197 |
Source: Public Records
Tax History Compared to Growth
Tax History
| Year | Tax Paid | Tax Assessment Tax Assessment Total Assessment is a certain percentage of the fair market value that is determined by local assessors to be the total taxable value of land and additions on the property. | Land | Improvement |
|---|---|---|---|---|
| 2025 | $2,819 | $562,100 | $120,000 | $442,100 |
| 2024 | $2,819 | $542,300 | $116,000 | $426,300 |
| 2023 | $2,779 | $503,900 | $105,500 | $398,400 |
| 2022 | $2,881 | $513,900 | $103,400 | $410,500 |
| 2021 | $2,413 | $391,900 | $81,000 | $310,900 |
| 2020 | $2,277 | $347,000 | $81,000 | $266,000 |
| 2019 | $2,294 | $342,800 | $81,000 | $261,800 |
| 2018 | $2,116 | $313,600 | $79,300 | $234,300 |
| 2017 | $2,002 | $295,400 | $79,300 | $216,100 |
| 2016 | $1,897 | $263,000 | $75,100 | $187,900 |
| 2015 | $1,803 | $243,800 | $78,800 | $165,000 |
| 2014 | $1,722 | $229,200 | $75,100 | $154,100 |
Source: Public Records
Map
Nearby Homes
- 7108 S 1205 W
- 7087 S 1205 W
- 1235 W Athleen Dr
- 1146 Athleen Dr
- 1384 W 7290 S
- 7340 S Seven Tree Ln Unit 76
- 7194 S 1380 W
- 6937 S Hollow View Way
- 7165 Callie Dr
- 7118 S Equator Ln Unit 14 B
- 6987 Overview Way
- 1607 W Beamon St
- 6773 S 1300 W
- 1516 W 7470 S
- 6687 Bonham Ln
- 1718 W Trey Way Unit 2
- 6660 S Ryker Vista Ln
- 7279 S Kenadi Ct
- 6486 S 1140 W Unit 182
- 6440 S 1190 W Unit 200
- 7135 S 1300 W
- 7125 S 1300 W
- 1283 W 7125 S
- 7157 S 1300 W
- 7123 S 1300 W
- 7123 S 1300 W Unit A
- 7177 S 1300 W
- 1284 W 7125 S
- 1305 W 7125 S
- 7181 1300 W
- 7181 S 1300 W
- 7181 S Temple Dr
- 7142 S Hall Dr Unit 19
- 7142 S Hall Dr
- 7183 1300 W
- 7153 S 1320 W
- 7185 S 1300 Eat Unit 4-V
- 7185 S 1300 Eat Unit 5-L
- 7185 S 1300 W
- 7185 S 1300 W Unit 4-T