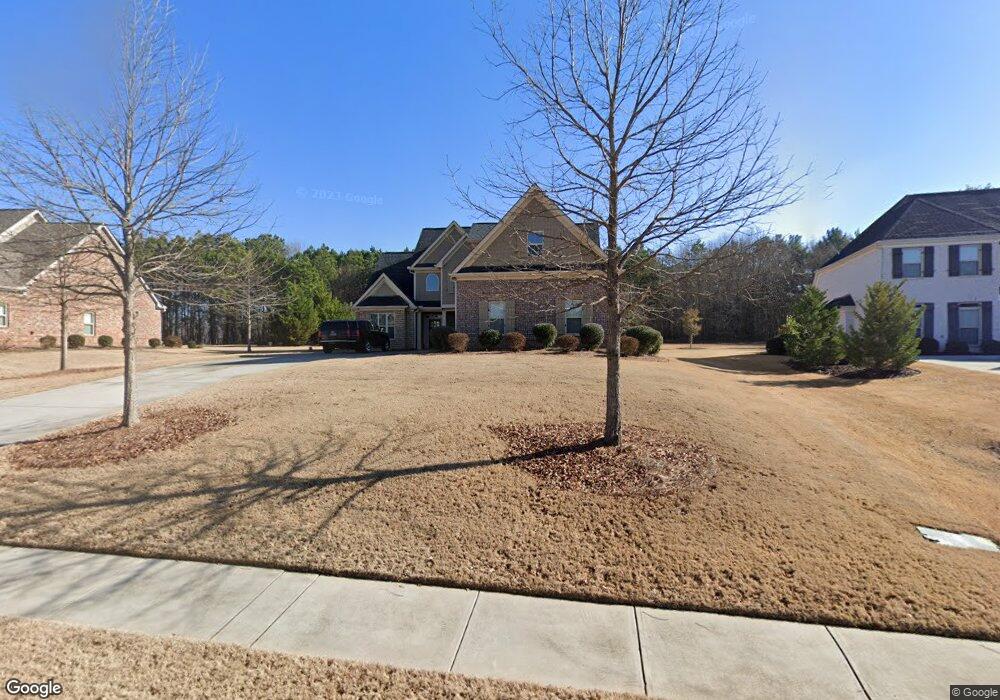
1291 Wild Indigo Crossing Unit 17F Statham, GA 30666
Estimated Value: $683,038 - $763,000
4
Beds
4
Baths
2,821
Sq Ft
$256/Sq Ft
Est. Value
About This Home
This home is located at 1291 Wild Indigo Crossing Unit 17F, Statham, GA 30666 and is currently estimated at $721,510, approximately $255 per square foot. 1291 Wild Indigo Crossing Unit 17F is a home located in Barrow County with nearby schools including Rocky Branch Elementary School, Malcom Bridge Middle School, and North Oconee High School.
Ownership History
Date
Name
Owned For
Owner Type
Purchase Details
Closed on
Jun 9, 2022
Sold by
Elm David
Bought by
Irvin Marc
Current Estimated Value
Home Financials for this Owner
Home Financials are based on the most recent Mortgage that was taken out on this home.
Original Mortgage
$479,200
Interest Rate
5.3%
Mortgage Type
Mortgage Modification
Purchase Details
Closed on
May 22, 2020
Sold by
Joh Jung S
Bought by
Elm David
Home Financials for this Owner
Home Financials are based on the most recent Mortgage that was taken out on this home.
Original Mortgage
$254,958
Interest Rate
3.3%
Mortgage Type
New Conventional
Purchase Details
Closed on
Mar 31, 2017
Bought by
Elm David and Joh Jung S
Home Financials for this Owner
Home Financials are based on the most recent Mortgage that was taken out on this home.
Original Mortgage
$252,500
Interest Rate
4.1%
Mortgage Type
Commercial
Purchase Details
Closed on
Oct 15, 2015
Sold by
Ellington Farms Developmen
Bought by
Athens Construction Grp Llc
Create a Home Valuation Report for This Property
The Home Valuation Report is an in-depth analysis detailing your home's value as well as a comparison with similar homes in the area
Home Values in the Area
Average Home Value in this Area
Purchase History
| Date | Buyer | Sale Price | Title Company |
|---|---|---|---|
| Irvin Marc | $599,000 | -- | |
| Elm David | -- | -- | |
| Elm David | $350,000 | -- | |
| Athens Construction Grp Llc | -- | -- |
Source: Public Records
Mortgage History
| Date | Status | Borrower | Loan Amount |
|---|---|---|---|
| Closed | Irvin Marc | $479,200 | |
| Previous Owner | Elm David | $254,958 | |
| Previous Owner | Elm David | $252,500 |
Source: Public Records
Tax History Compared to Growth
Tax History
| Year | Tax Paid | Tax Assessment Tax Assessment Total Assessment is a certain percentage of the fair market value that is determined by local assessors to be the total taxable value of land and additions on the property. | Land | Improvement |
|---|---|---|---|---|
| 2024 | $4,452 | $237,651 | $39,600 | $198,051 |
| 2023 | $4,452 | $225,762 | $40,000 | $185,762 |
| 2022 | $4,365 | $201,274 | $40,000 | $161,274 |
| 2021 | $4,088 | $174,545 | $28,000 | $146,545 |
| 2020 | $3,687 | $156,970 | $20,000 | $136,970 |
| 2019 | $3,553 | $151,203 | $20,000 | $131,203 |
| 2018 | $3,363 | $142,605 | $20,000 | $122,605 |
| 2017 | $3,201 | $133,163 | $20,000 | $113,163 |
| 2016 | $1,612 | $66,084 | $20,000 | $46,084 |
| 2015 | $292 | $10,200 | $10,200 | $0 |
Source: Public Records
Map
Nearby Homes
- 1291 Wild Indigo Crossing
- 1373 Wild Indigo Crossing
- 1189 Wild Indigo Crossing Unit 16F
- 1189 Wild Indigo Crossing
- 1455 Wild Indigo Crossing Unit 19F
- 1455 Wild Indigo Crossing
- 1991 Dials Mill Rd
- 2042 Dials Mill Rd
- 2063 Dials Mill Rd Unit 2
- 2063 Dials Mill Rd Unit 3
- 2063 Dials Mill Rd Unit 1
- 2063 Dials Mill Rd
- 1065 Wild Indigo Crossing
- 1591 Wild Indigo Crossing Unit F20
- 1591 Wild Indigo Crossing Unit 20F
- 1591 Wild Indigo Crossing
- 1390 Wild Indigo Crossing Unit F10
- 1390 Wild Indigo Crossing
- 1212 Wild Indigo Crossing Unit F11
- 1212 Wild Indigo Crossing