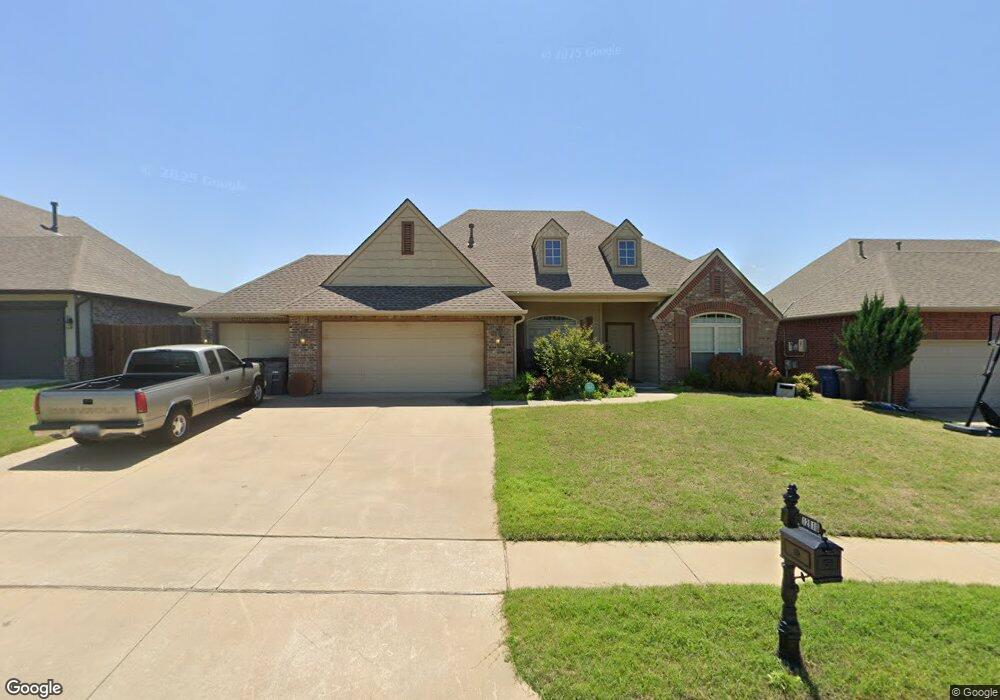
12910 E 43rd St Tulsa, OK 74134
Park Plaza East NeighborhoodEstimated Value: $316,804 - $380,000
3
Beds
3
Baths
2,357
Sq Ft
$148/Sq Ft
Est. Value
About This Home
This home is located at 12910 E 43rd St, Tulsa, OK 74134 and is currently estimated at $349,201, approximately $148 per square foot. 12910 E 43rd St is a home located in Tulsa County with nearby schools including Rosa Parks Elementary School, Union 8th Grade Center, and Union 6th-7th Grade Center.
Ownership History
Date
Name
Owned For
Owner Type
Purchase Details
Closed on
Jul 10, 2019
Sold by
Williams Carl Lee
Bought by
Williams Carl Lee and Whitley William Devon
Current Estimated Value
Purchase Details
Closed on
Aug 16, 2013
Sold by
Williams Arlene
Bought by
Williams Carl Lee
Purchase Details
Closed on
Jul 10, 2008
Sold by
Landmark Homes Llc
Bought by
Williams Carl L and Williams Arlene
Home Financials for this Owner
Home Financials are based on the most recent Mortgage that was taken out on this home.
Original Mortgage
$176,000
Outstanding Balance
$112,678
Interest Rate
6.09%
Mortgage Type
New Conventional
Estimated Equity
$236,523
Purchase Details
Closed on
Dec 4, 2007
Sold by
Battle Creek Land Development Inc
Bought by
Landmark Homes Llc
Home Financials for this Owner
Home Financials are based on the most recent Mortgage that was taken out on this home.
Original Mortgage
$172,640
Interest Rate
6.4%
Mortgage Type
Construction
Create a Home Valuation Report for This Property
The Home Valuation Report is an in-depth analysis detailing your home's value as well as a comparison with similar homes in the area
Home Values in the Area
Average Home Value in this Area
Purchase History
| Date | Buyer | Sale Price | Title Company |
|---|---|---|---|
| Williams Carl Lee | -- | None Available | |
| Williams Carl Lee | -- | None Available | |
| Williams Carl L | $220,500 | Frisco Title Corporation | |
| Landmark Homes Llc | $40,000 | None Available |
Source: Public Records
Mortgage History
| Date | Status | Borrower | Loan Amount |
|---|---|---|---|
| Open | Williams Carl L | $176,000 | |
| Previous Owner | Landmark Homes Llc | $172,640 |
Source: Public Records
Tax History
| Year | Tax Paid | Tax Assessment Tax Assessment Total Assessment is a certain percentage of the fair market value that is determined by local assessors to be the total taxable value of land and additions on the property. | Land | Improvement |
|---|---|---|---|---|
| 2025 | $4,233 | $30,956 | $3,804 | $27,152 |
| 2024 | $3,590 | $29,483 | $4,284 | $25,199 |
| 2023 | $3,590 | $28,078 | $3,935 | $24,143 |
| 2022 | $3,563 | $26,742 | $4,505 | $22,237 |
| 2021 | $3,437 | $25,468 | $4,290 | $21,178 |
| 2020 | $3,226 | $24,255 | $4,400 | $19,855 |
| 2019 | $3,339 | $24,255 | $4,400 | $19,855 |
| 2018 | $3,331 | $24,255 | $4,400 | $19,855 |
| 2017 | $3,351 | $24,255 | $4,400 | $19,855 |
| 2016 | $3,277 | $24,255 | $4,400 | $19,855 |
| 2015 | $3,312 | $24,255 | $4,400 | $19,855 |
| 2014 | $3,260 | $24,255 | $4,400 | $19,855 |
Source: Public Records
Map
Nearby Homes
- 13302 E 43rd St
- 4310 S 134th East Place
- 4517 S 135th East Ave
- 4010 S 133rd East Ave
- 3914 S 125th East Ave
- 3923 S 122nd Ave E
- 12517 E 38th St
- 14715 E 39th St S
- 12452 E 36th St
- 13432 E 36th St
- 4030 S 118th East Ave
- 12404 E 35th St
- 12180 E 35th St
- 12624 E 33rd Ct
- 3850 S 117th East Ave
- 12939 E 34th St
- 14002 E 36th St
- 4932 N Walnut Ave
- 4916 N Walnut Ave
- 4924 N Walnut Ave
- 12906 E 43rd St
- 13002 E 43rd St
- 12909 E 43rd Place
- 13001 E 43rd Place
- 12905 E 43rd Place
- 12902 E 43rd St
- 13005 E 43rd Place
- 13006 E 43rd St
- 12901 E 43rd Place
- 13010 E 43rd St
- 13009 E 43rd Place
- 0 S 129th East Ave
- 4220 S 131st East Ave
- 13014 E 43rd St
- 4216 S 131st East Ave
- 4216 S 131st Ave E
- 4216 S 131st East Ave
- 13013 E 43rd Place
- 13013 E 43rd Place S
- 0 129th Ave Unit 2008611
Your Personal Tour Guide
Ask me questions while you tour the home.