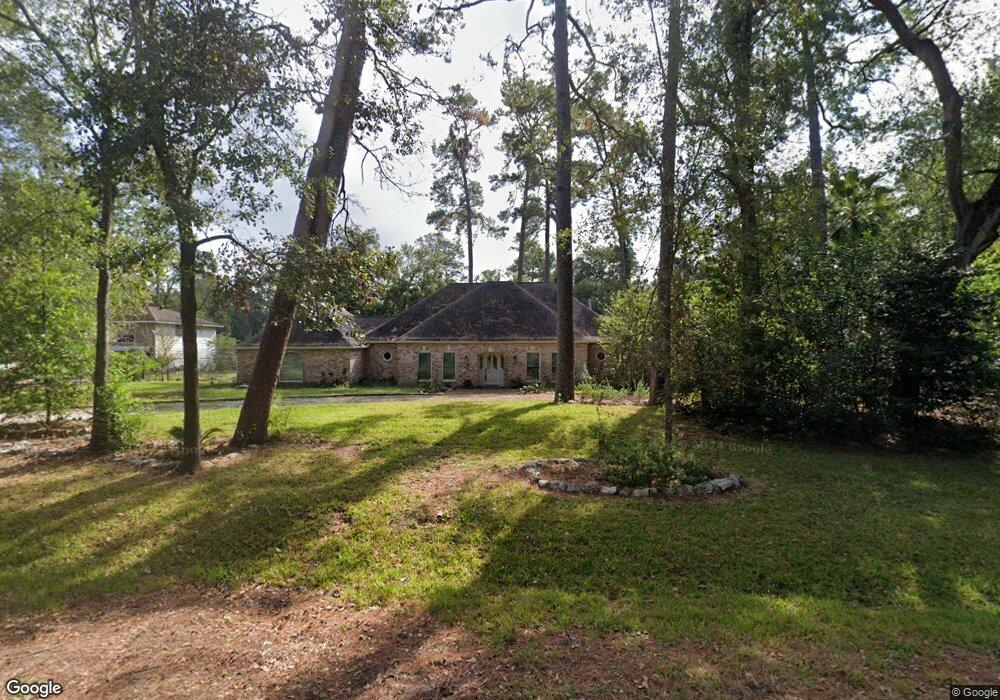
12912 Chavile Cypress, TX 77429
Estimated Value: $530,000 - $640,000
4
Beds
4
Baths
4,067
Sq Ft
$144/Sq Ft
Est. Value
About This Home
This home is located at 12912 Chavile, Cypress, TX 77429 and is currently estimated at $585,595, approximately $143 per square foot. 12912 Chavile is a home located in Harris County with nearby schools including Millsap Elementary School, Hamilton Middle School, and Cypress Creek High School.
Ownership History
Date
Name
Owned For
Owner Type
Purchase Details
Closed on
Jun 16, 2017
Sold by
Bryant Deborah Eileen
Bought by
Brust David M and Brust Ann K
Current Estimated Value
Home Financials for this Owner
Home Financials are based on the most recent Mortgage that was taken out on this home.
Original Mortgage
$317,460
Outstanding Balance
$262,969
Interest Rate
3.87%
Mortgage Type
FHA
Estimated Equity
$322,626
Purchase Details
Closed on
Oct 12, 2000
Sold by
Bryant Claude Armand
Bought by
Bryant Deborah Eileen
Home Financials for this Owner
Home Financials are based on the most recent Mortgage that was taken out on this home.
Original Mortgage
$135,650
Interest Rate
7.89%
Mortgage Type
Purchase Money Mortgage
Purchase Details
Closed on
Oct 9, 1996
Sold by
Campellone Katherine B
Bought by
Bryant Claude Armand and Bryant Deborah Eileen
Home Financials for this Owner
Home Financials are based on the most recent Mortgage that was taken out on this home.
Original Mortgage
$139,650
Interest Rate
8.09%
Create a Home Valuation Report for This Property
The Home Valuation Report is an in-depth analysis detailing your home's value as well as a comparison with similar homes in the area
Home Values in the Area
Average Home Value in this Area
Purchase History
| Date | Buyer | Sale Price | Title Company |
|---|---|---|---|
| Brust David M | -- | Frontier Title Co | |
| Bryant Deborah Eileen | -- | -- | |
| Bryant Claude Armand | -- | Commonwealth Land Title Co |
Source: Public Records
Mortgage History
| Date | Status | Borrower | Loan Amount |
|---|---|---|---|
| Open | Brust David M | $317,460 | |
| Previous Owner | Bryant Deborah Eileen | $135,650 | |
| Previous Owner | Bryant Claude Armand | $139,650 |
Source: Public Records
Tax History Compared to Growth
Tax History
| Year | Tax Paid | Tax Assessment Tax Assessment Total Assessment is a certain percentage of the fair market value that is determined by local assessors to be the total taxable value of land and additions on the property. | Land | Improvement |
|---|---|---|---|---|
| 2025 | $4,046 | $551,884 | $161,810 | $390,074 |
| 2024 | $4,046 | $635,923 | $161,810 | $474,113 |
| 2023 | $4,046 | $498,000 | $161,810 | $336,190 |
| 2022 | $8,621 | $423,500 | $147,100 | $276,400 |
| 2021 | $8,235 | $381,000 | $147,100 | $233,900 |
| 2020 | $7,930 | $355,720 | $147,100 | $208,620 |
| 2019 | $7,980 | $356,800 | $73,550 | $283,250 |
| 2018 | $3,244 | $312,810 | $73,550 | $239,260 |
| 2017 | $7,106 | $307,000 | $67,740 | $239,260 |
| 2016 | $7,106 | $331,358 | $67,740 | $263,618 |
| 2015 | $4,792 | $300,377 | $67,740 | $232,637 |
| 2014 | $4,792 | $281,525 | $44,031 | $237,494 |
Source: Public Records
Map
Nearby Homes
- 12919 King Cir
- 12755 Mill Ridge Dr Unit 612
- 12755 Mill Ridge Dr Unit 518
- 12755 Mill Ridge Dr Unit 402
- 12755 Mill Ridge Dr Unit 213
- 12755 Mill Ridge Dr Unit 101
- 12755 Mill Ridge Dr Unit 606
- 12755 Mill Ridge Dr Unit 1103
- 13219 Regency Oak Ln
- 12511 Limber Pine Place
- 6 Oak Hollow Cir
- 12506 Limber Pine Place
- 12518 Sableleaf Dr
- 12519 Costal Bend Way
- 12510 Costal Bend Way
- 12506 Costal Bend Way
- 12418 E Shadow Lake Ln
- 11226 Sky Ridge Dr
- 11350 Grant Rd
- 13123 Parc Lake Edge Dr
- 12922 Chavile
- 12919 Carla Way
- 12902 Chavile
- 12911 Carla Way
- 12923 Carla Way
- 12924 Chavile
- 12907 Chavile
- 12915 Chavile
- 12919 Chavile
- 12903 Chavile
- 12927 Carla Way
- 12907 Carla Way
- 12926 Chavile
- 12923 Chavile
- 12903 Carla Way
- 12931 Carla Way
- 12918 Carla Way
- 12927 Chavile
- 12930 Chavile
- 12914 Lynn Haven St