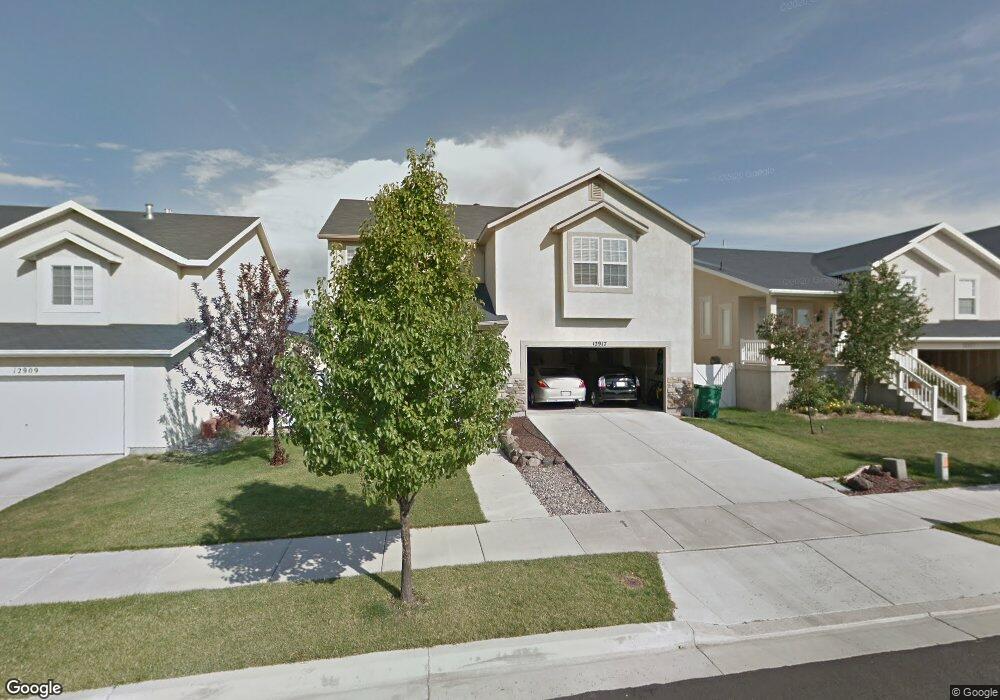
12917 Grindstone Cir Riverton, UT 84096
Estimated Value: $554,000 - $654,000
4
Beds
2
Baths
2,586
Sq Ft
$236/Sq Ft
Est. Value
About This Home
This home is located at 12917 Grindstone Cir, Riverton, UT 84096 and is currently estimated at $609,614, approximately $235 per square foot. 12917 Grindstone Cir is a home located in Salt Lake County with nearby schools including Silver Crest School, Copper Mountain Middle School, and Herriman High School.
Ownership History
Date
Name
Owned For
Owner Type
Purchase Details
Closed on
Apr 8, 2010
Sold by
Dehaan Rick Joseph and Dehaan Sarah Muir
Bought by
Klingbiel Stephanie
Current Estimated Value
Purchase Details
Closed on
Oct 21, 2004
Sold by
W Springs Llc
Bought by
Dehaan Rick Joseph and Dehaan Sarah Muir
Home Financials for this Owner
Home Financials are based on the most recent Mortgage that was taken out on this home.
Original Mortgage
$167,536
Interest Rate
4.37%
Mortgage Type
Purchase Money Mortgage
Create a Home Valuation Report for This Property
The Home Valuation Report is an in-depth analysis detailing your home's value as well as a comparison with similar homes in the area
Home Values in the Area
Average Home Value in this Area
Purchase History
| Date | Buyer | Sale Price | Title Company |
|---|---|---|---|
| Klingbiel Stephanie | -- | Titan Title Ins Agcy Inc | |
| Dehaan Rick Joseph | -- | Meridian Title |
Source: Public Records
Mortgage History
| Date | Status | Borrower | Loan Amount |
|---|---|---|---|
| Previous Owner | Dehaan Rick Joseph | $167,536 | |
| Closed | Dehaan Rick Joseph | $31,413 |
Source: Public Records
Tax History
| Year | Tax Paid | Tax Assessment Tax Assessment Total Assessment is a certain percentage of the fair market value that is determined by local assessors to be the total taxable value of land and additions on the property. | Land | Improvement |
|---|---|---|---|---|
| 2025 | $3,236 | $579,400 | $131,200 | $448,200 |
| 2024 | $3,236 | $560,000 | $127,200 | $432,800 |
| 2023 | $3,301 | $538,600 | $93,200 | $445,400 |
| 2022 | $3,411 | $546,000 | $91,400 | $454,600 |
| 2021 | $2,797 | $398,600 | $74,230 | $324,370 |
| 2020 | $2,626 | $348,900 | $64,800 | $284,100 |
| 2019 | $2,729 | $345,500 | $64,800 | $280,700 |
| 2016 | $2,456 | $275,300 | $62,800 | $212,500 |
Source: Public Records
Map
Nearby Homes
- 12827 S Tortoise Ln
- 4968 W Ticoa Ln
- 12784 S Timber Run Dr
- 12793 Aspen Springs Dr
- 13032 S Tortola Dr Unit 201
- 12801 Stormy Meadow Dr
- 5056 W Bilston Ln
- 4896 W Aspen Springs Dr
- 13057 Cannon View Dr
- 4933 W Pillar Dr
- 13092 S Tortola Dr Unit L304
- 13123 S Bilston Ln
- 13062 S Keegan Dr Unit I304
- 13221 S Dominica Ln Unit 303
- 13221 S Dominica Ln Unit E201
- 13222 S Dominica Ln Unit J304
- 12630 S Alpine Lake Ln Unit 202
- 4962 W Badger Ln
- 12762 S Ashington Ln
- 5017 W Samana Ln Unit 204
- 12917 S Grindstone Cir
- 12909 Grindstone Cir
- 12927 Grindstone Cir
- 12927 S Grindstone Cir
- 12909 S Grindstone Cir
- 12916 Cactus Berry Dr
- 12916 S Cactus Berry Dr
- 12933 Grindstone Cir
- 12901 Grindstone Cir
- 12924 Cactus Berry Dr
- 12924 S Cactus Berry Dr
- 12908 Cactus Berry Dr
- 12908 S Cactus Berry Dr
- 12932 Cactus Berry Dr
- 12902 Cactus Berry Dr
- 12922 Grindstone Cir
- 12912 S Grindstone Cir
- 12922 S Grindstone Cir
- 12897 S Grindstone Cir
- 12941 Wild Mare Way
Your Personal Tour Guide
Ask me questions while you tour the home.