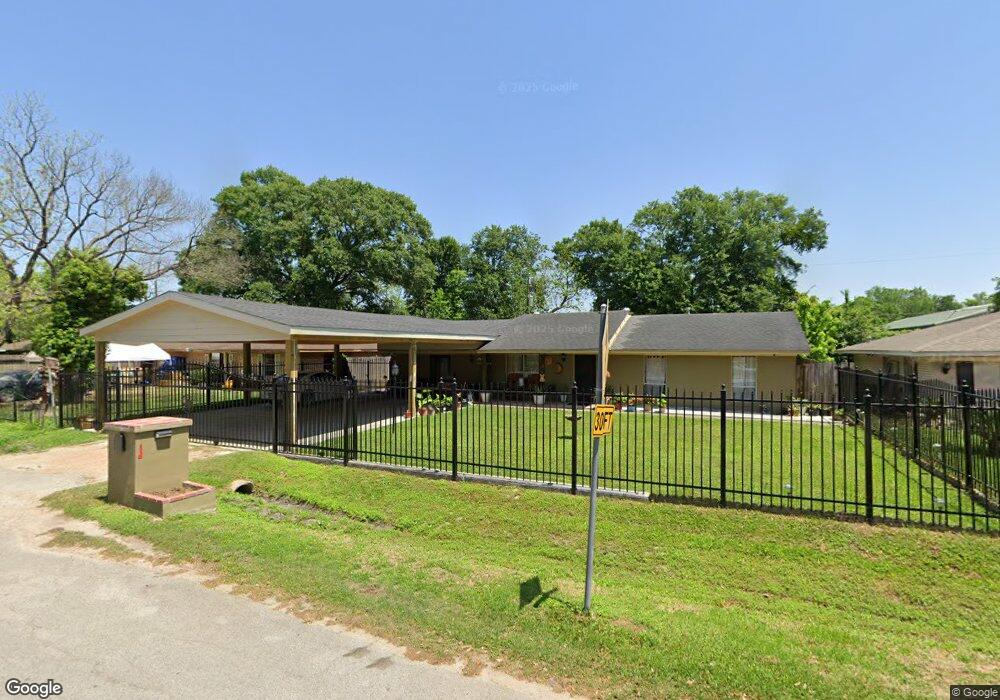
12918 Slater Ln Houston, TX 77039
Estimated Value: $223,000 - $336,000
3
Beds
2
Baths
1,740
Sq Ft
$149/Sq Ft
Est. Value
About This Home
This home is located at 12918 Slater Ln, Houston, TX 77039 and is currently estimated at $259,764, approximately $149 per square foot. 12918 Slater Ln is a home located in Harris County with nearby schools including Hinojosa EC/PK/K, Raymond Academy, and Grantham Academy.
Ownership History
Date
Name
Owned For
Owner Type
Purchase Details
Closed on
Sep 16, 2004
Sold by
French Dale
Bought by
Ortega Maria E
Current Estimated Value
Home Financials for this Owner
Home Financials are based on the most recent Mortgage that was taken out on this home.
Original Mortgage
$22,000
Interest Rate
5.8%
Mortgage Type
Seller Take Back
Purchase Details
Closed on
Nov 29, 1999
Sold by
Cole Garry C and Cole Lisa M
Bought by
Ortega Jose R and Ortega Maria E
Home Financials for this Owner
Home Financials are based on the most recent Mortgage that was taken out on this home.
Original Mortgage
$63,967
Interest Rate
7.93%
Mortgage Type
FHA
Purchase Details
Closed on
Aug 17, 1995
Sold by
Kelley Jack H and Kelley Barbara A
Bought by
Cole Garry C and Cole Lisa M
Home Financials for this Owner
Home Financials are based on the most recent Mortgage that was taken out on this home.
Original Mortgage
$33,000
Interest Rate
7.39%
Mortgage Type
Seller Take Back
Create a Home Valuation Report for This Property
The Home Valuation Report is an in-depth analysis detailing your home's value as well as a comparison with similar homes in the area
Home Values in the Area
Average Home Value in this Area
Purchase History
| Date | Buyer | Sale Price | Title Company |
|---|---|---|---|
| Ortega Maria E | -- | Alamo Title Company | |
| Ortega Jose R | -- | Texas American Title Company | |
| Cole Garry C | -- | -- |
Source: Public Records
Mortgage History
| Date | Status | Borrower | Loan Amount |
|---|---|---|---|
| Closed | Ortega Maria E | $22,000 | |
| Previous Owner | Ortega Jose R | $63,967 | |
| Previous Owner | Cole Garry C | $33,000 |
Source: Public Records
Tax History Compared to Growth
Tax History
| Year | Tax Paid | Tax Assessment Tax Assessment Total Assessment is a certain percentage of the fair market value that is determined by local assessors to be the total taxable value of land and additions on the property. | Land | Improvement |
|---|---|---|---|---|
| 2025 | $1,982 | $187,400 | $40,500 | $146,900 |
| 2024 | $1,982 | $230,060 | $40,500 | $189,560 |
| 2023 | $1,982 | $230,060 | $40,500 | $189,560 |
| 2022 | $2,841 | $143,867 | $20,250 | $123,617 |
| 2021 | $2,707 | $136,385 | $20,250 | $116,135 |
| 2020 | $2,594 | $154,031 | $20,250 | $133,781 |
| 2019 | $2,469 | $103,791 | $20,250 | $83,541 |
| 2018 | $1,131 | $103,791 | $15,188 | $88,603 |
| 2017 | $2,352 | $103,791 | $15,188 | $88,603 |
| 2016 | $2,323 | $103,791 | $15,188 | $88,603 |
| 2015 | $1,583 | $94,794 | $15,188 | $79,606 |
| 2014 | $1,583 | $84,693 | $15,188 | $69,505 |
Source: Public Records
Map
Nearby Homes
- 13113 Reeveston Rd
- 28351 W Hardy Rd
- 13310 Robertcrest St Unit B
- 12969 W Hardy Rd
- 1810 Connorvale Rd
- 13530 Luthe Rd
- 13635 Reeveston Rd
- 13610 Carmilenda St
- 14215 Sweeney Rd
- 1449 Mesquite St
- 822 Aldine Mail Route Rd
- 1450 Mesquite St
- 1720 Strawn Rd
- 1730 Strawn Rd
- 12123 Steeple Ln
- 814 Isetta Ln
- 1722 Strawn Rd
- 0 Verhalen
- 1725 Strawn Rd
- 13920 Reeveston Rd
- 12922 Slater Ln
- 12914 Slater Ln
- 12926 Slater Ln
- 12910 Slater Ln
- 12919 Slater Ln
- 12923 Slater Ln
- 12915 Slater Ln
- 12906 Slater Ln
- 1406 Aldine Mail Rd
- 12911 Slater Ln
- 12901 Chrisman Rd
- 1402 Aldine Mail Route
- 1426 Aldine Mail Rd
- 12915 Chrisman Rd
- 12907 Slater Ln
- 12902 Slater Ln
- 12903 Slater Ln
- 1502 Aldine Mail Rd
- 1324 Aldine Mail Rd
- 12802 Chrisman Rd