12919 Glengate Rd Midlothian, VA 23114
Estimated Value: $443,000 - $478,000
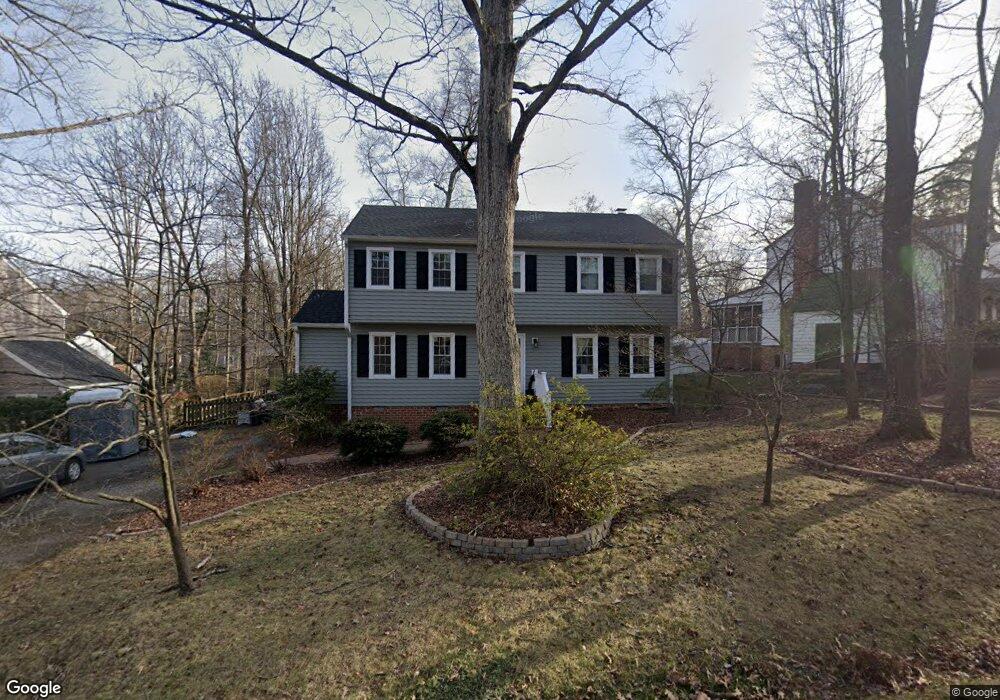
About This Home
This home is located at 12919 Glengate Rd, Midlothian, VA 23114 and is currently estimated at $457,447, approximately $205 per square foot. 12919 Glengate Rd is a home located in Chesterfield County with nearby schools including J B Watkins Elementary School, Midlothian Middle School, and Midlothian High School.
Ownership History
We collect this data history from publicly available records. To have your information removed, we recommend requesting removal directly through your county’s website.
Purchase Details
Purchase Details
Home Financials for this Owner
Home Financials are based on the most recent Mortgage that was taken out on this home.Purchase Details
Home Financials for this Owner
Home Financials are based on the most recent Mortgage that was taken out on this home.Home Values in the Area
Average Home Value in this Area
Purchase History
We collect this data history from publicly available records. To have your information removed, we recommend requesting removal directly through your county’s website.
| Date | Buyer | Sale Price | Title Company |
|---|---|---|---|
| -- | None Available | ||
| $265,000 | -- | ||
| $90,000 | -- |
Mortgage History
We collect this data history from publicly available records. To have your information removed, we recommend requesting removal directly through your county’s website.
| Date | Status | Borrower | Loan Amount |
|---|---|---|---|
| Open | $212,000 | ||
| Previous Owner | $85,450 |
Tax History
We collect this data history from publicly available records. To have your information removed, we recommend requesting removal directly through your county’s website.
| Year | Tax Paid | Tax Assessment Tax Assessment Total Assessment is a certain percentage of the fair market value that is determined by local assessors to be the total taxable value of land and additions on the property. | Land | Improvement |
|---|---|---|---|---|
| 2026 | $3,682 | $410,900 | $93,000 | $317,900 |
| 2025 | $3,682 | $400,900 | $83,000 | $317,900 |
| 2024 | $3,593 | $374,100 | $76,000 | $298,100 |
| 2023 | $3,292 | $361,800 | $74,000 | $287,800 |
| 2022 | $3,055 | $332,100 | $70,000 | $262,100 |
| 2021 | $2,865 | $294,600 | $68,000 | $226,600 |
| 2020 | $2,632 | $277,100 | $65,000 | $212,100 |
| 2019 | $2,563 | $269,800 | $65,000 | $204,800 |
| 2018 | $2,446 | $257,500 | $62,000 | $195,500 |
| 2017 | $2,423 | $252,400 | $62,000 | $190,400 |
| 2016 | $2,367 | $246,600 | $60,000 | $186,600 |
| 2015 | $2,278 | $234,700 | $58,000 | $176,700 |
| 2014 | $2,166 | $223,000 | $56,000 | $167,000 |
Map
- 13006 Edgetree Ct
- 13262 Brattice Loop
- 13240 Brattice Loop
- 13232 Brattice Loop
- 13216 Brattice Loop
- 13208 Brattice Loop
- 13204 Brattice Loop
- 13244 Brattice Loop
- 13236 Brattice Loop
- 13224 Brattice Loop
- 13220 Brattice Loop
- 13212 Brattice Loop
- 13200 Brattice Loop
- 241 Brattice Dr
- 239 Brattice Dr
- 235 Brattice Dr
- 231 Brattice Dr
- 227 Brattice Dr
- 225 Brattice Dr
- 247 Brattice Dr
- 12913 Glengate Rd
- 12925 Glengate Rd
- 12908 Edgetree Terrace
- 12906 Edgetree Terrace
- 12910 Edgetree Terrace
- 12907 Glengate Rd
- 12918 Glengate Rd
- 12904 Edgetree Terrace
- 12912 Glengate Rd
- 13001 Glengate Rd
- 12906 Glengate Rd
- 12902 Edgetree Terrace
- 12901 Glengate Rd
- 13000 Edgetree Ct
- 13000 Glengate Rd
- 12900 Glengate Rd
- 12907 Edgetree Terrace
- 13003 Glengate Rd
- 12905 Edgetree Terrace
- 12900 Edgetree Terrace
Ask me questions while you tour the home.