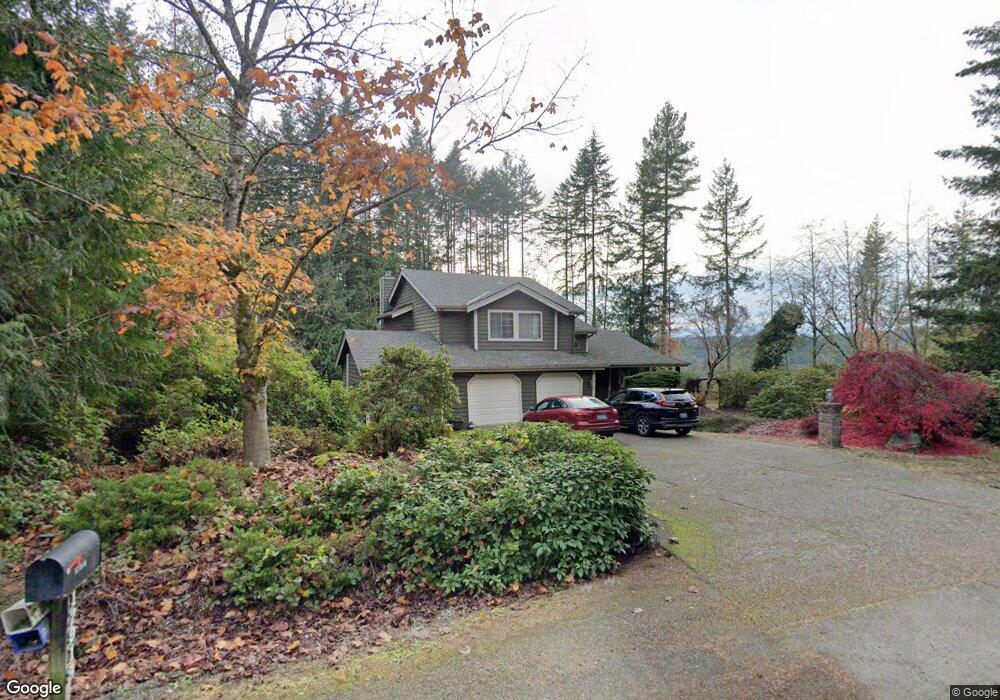
12919 Westridge Dr NW Silverdale, WA 98383
Estimated Value: $621,000 - $672,000
4
Beds
3
Baths
2,035
Sq Ft
$313/Sq Ft
Est. Value
About This Home
This home is located at 12919 Westridge Dr NW, Silverdale, WA 98383 and is currently estimated at $637,120, approximately $313 per square foot. 12919 Westridge Dr NW is a home located in Kitsap County with nearby schools including Emerald Heights Elementary School, Ridgetop Middle School, and Central Kitsap High School.
Ownership History
Date
Name
Owned For
Owner Type
Purchase Details
Closed on
Aug 5, 2004
Sold by
Hart Stephanie R
Bought by
Hart Shane E
Current Estimated Value
Home Financials for this Owner
Home Financials are based on the most recent Mortgage that was taken out on this home.
Original Mortgage
$192,000
Outstanding Balance
$94,704
Interest Rate
5.92%
Mortgage Type
New Conventional
Estimated Equity
$542,416
Purchase Details
Closed on
Sep 19, 2002
Sold by
Petersen Russell J and Petersen Nancy H
Bought by
Hart Shane E and Hart Stephanie R
Home Financials for this Owner
Home Financials are based on the most recent Mortgage that was taken out on this home.
Original Mortgage
$183,150
Interest Rate
6.24%
Purchase Details
Closed on
Jun 9, 1998
Sold by
Clifford Phillip W
Bought by
Petersen Russell J and Petersen Nancy H
Home Financials for this Owner
Home Financials are based on the most recent Mortgage that was taken out on this home.
Original Mortgage
$144,800
Interest Rate
7.17%
Create a Home Valuation Report for This Property
The Home Valuation Report is an in-depth analysis detailing your home's value as well as a comparison with similar homes in the area
Home Values in the Area
Average Home Value in this Area
Purchase History
| Date | Buyer | Sale Price | Title Company |
|---|---|---|---|
| Hart Shane E | -- | Transnation Title | |
| Hart Shane E | $215,500 | First American Title Ins | |
| Petersen Russell J | $181,000 | Land Title Company |
Source: Public Records
Mortgage History
| Date | Status | Borrower | Loan Amount |
|---|---|---|---|
| Open | Hart Shane E | $192,000 | |
| Closed | Hart Shane E | $183,150 | |
| Previous Owner | Petersen Russell J | $144,800 |
Source: Public Records
Tax History Compared to Growth
Tax History
| Year | Tax Paid | Tax Assessment Tax Assessment Total Assessment is a certain percentage of the fair market value that is determined by local assessors to be the total taxable value of land and additions on the property. | Land | Improvement |
|---|---|---|---|---|
| 2026 | $5,457 | $582,160 | $137,930 | $444,230 |
| 2025 | $5,457 | $582,160 | $137,930 | $444,230 |
| 2024 | $5,307 | $582,160 | $137,930 | $444,230 |
| 2023 | $5,204 | $568,220 | $153,100 | $415,120 |
| 2022 | $5,013 | $482,660 | $130,040 | $352,620 |
| 2021 | $4,829 | $442,590 | $118,980 | $323,610 |
| 2020 | $4,432 | $411,040 | $109,750 | $301,290 |
| 2019 | $4,235 | $380,430 | $101,450 | $278,980 |
| 2018 | $4,550 | $337,280 | $80,170 | $257,110 |
| 2017 | $4,293 | $337,280 | $80,170 | $257,110 |
| 2016 | $4,151 | $301,400 | $80,170 | $221,230 |
| 2015 | $3,975 | $301,400 | $80,170 | $221,230 |
| 2014 | -- | $283,470 | $80,170 | $203,300 |
| 2013 | -- | $283,470 | $80,170 | $203,300 |
Source: Public Records
Map
Nearby Homes
- 12698 Plateau Cir NW
- 12281 Ridgepoint Cir NW
- 1504 NW Lakehill Cir
- 1330 NW Slate Ln Unit 101
- 11941 Schold Rd NW
- 1700 NW Marmot Ct
- 13727 Templeton Ave NW
- 3303 NW Half Mile Rd
- 11658 Breckenridge Ln NW
- 1603 Seasons Ln NW
- 2149 NW Rustling Fir Ln
- 2074 NW Winterset Ln
- 1995 NW Rustling Fir Ln
- 3761 NW Trigger Ave
- 13387 Calico Place NW
- 1940 NW Rustling Fir Ln
- 11736 Brian Ln NW
- 0 Greaves Way Unit NWM2347701
- 13375 Central Valley Rd NE
- 0 Clear Creek Rd NW
- 12909 Westridge Dr NW
- 12920 Westridge Dr NW
- 12899 Westridge Dr NW
- 12930 Westridge Dr NW
- 12889 Westridge Dr NW
- 1989 NW Lucky Ln
- 12940 Westridge Dr NW
- 12759 Silverdale Way NW
- 12879 Westridge Dr NW
- 1988 NW Lucky Ln
- 1945 NW Lucky Ln
- 12705 Silverdale Way NW
- 12703 Silverdale Way NW
- 12869 Westridge Dr NW
- 12950 Westridge Dr NW
- 12949 Westridge Dr NW
- 1944 NW Lucky Ln
- 12683 Silverdale Way NW
- 1846 NW Forest Creek Dr
- 1905 NW Lucky Ln