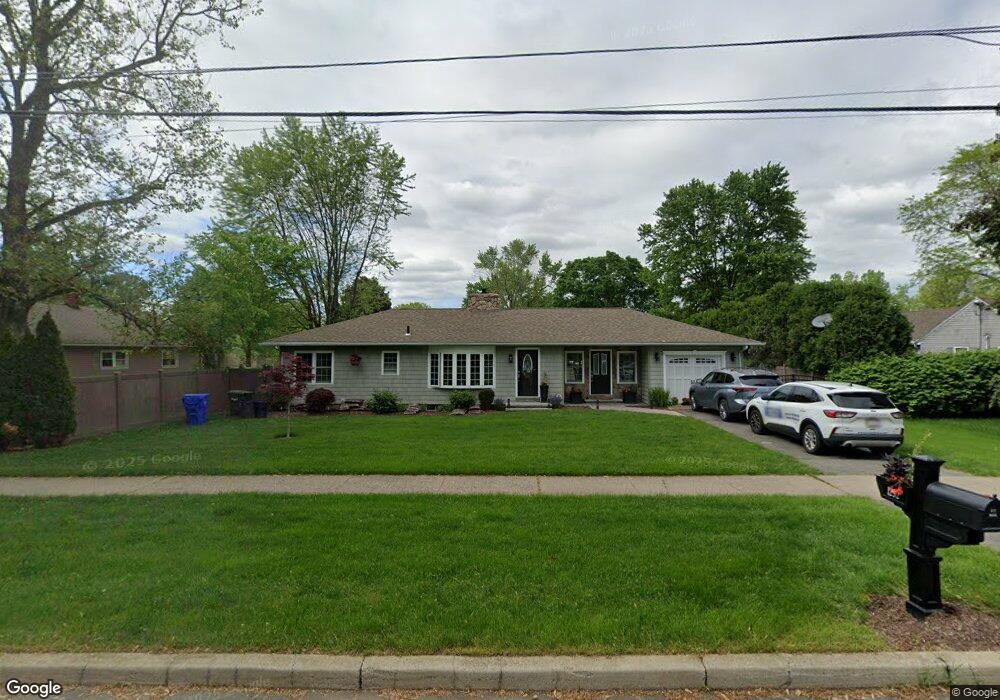
1292 Wilbraham Rd Springfield, MA 01119
Sixteen Acres NeighborhoodEstimated Value: $301,000 - $338,000
3
Beds
1
Bath
1,310
Sq Ft
$244/Sq Ft
Est. Value
About This Home
This home is located at 1292 Wilbraham Rd, Springfield, MA 01119 and is currently estimated at $320,222, approximately $244 per square foot. 1292 Wilbraham Rd is a home located in Hampden County with nearby schools including Glickman Elementary, John J Duggan Middle, and Springfield High School of Science and Technology.
Ownership History
Date
Name
Owned For
Owner Type
Purchase Details
Closed on
Nov 18, 2004
Sold by
Lebeau Arthur J and Stoler Deborah J
Bought by
Savoit Carolyn B and Savoit Harry L
Current Estimated Value
Home Financials for this Owner
Home Financials are based on the most recent Mortgage that was taken out on this home.
Original Mortgage
$84,000
Outstanding Balance
$41,975
Interest Rate
5.8%
Mortgage Type
Purchase Money Mortgage
Estimated Equity
$278,247
Create a Home Valuation Report for This Property
The Home Valuation Report is an in-depth analysis detailing your home's value as well as a comparison with similar homes in the area
Home Values in the Area
Average Home Value in this Area
Purchase History
| Date | Buyer | Sale Price | Title Company |
|---|---|---|---|
| Savoit Carolyn B | $105,000 | -- |
Source: Public Records
Mortgage History
| Date | Status | Borrower | Loan Amount |
|---|---|---|---|
| Open | Savoit Carolyn B | $84,000 |
Source: Public Records
Tax History
| Year | Tax Paid | Tax Assessment Tax Assessment Total Assessment is a certain percentage of the fair market value that is determined by local assessors to be the total taxable value of land and additions on the property. | Land | Improvement |
|---|---|---|---|---|
| 2025 | $4,370 | $278,700 | $52,500 | $226,200 |
| 2024 | $3,753 | $233,700 | $52,500 | $181,200 |
| 2023 | $3,212 | $188,400 | $50,000 | $138,400 |
| 2022 | $3,416 | $181,500 | $50,000 | $131,500 |
| 2021 | $3,315 | $175,400 | $45,500 | $129,900 |
| 2020 | $3,228 | $165,300 | $45,500 | $119,800 |
| 2019 | $3,035 | $154,200 | $45,500 | $108,700 |
| 2018 | $3,167 | $160,900 | $45,500 | $115,400 |
| 2017 | $2,994 | $152,300 | $45,400 | $106,900 |
| 2016 | $2,766 | $140,700 | $45,400 | $95,300 |
| 2015 | $2,724 | $138,500 | $45,400 | $93,100 |
Source: Public Records
Map
Nearby Homes
- 106-108 Breckwood Cir
- 74 Valley Rd
- 73 Timber Ln
- 64 Wilmington St
- 108 Birchland Ave
- 854 Grayson Dr
- 63 Lawton St
- 8 Putnam St
- 251 Rosewell St
- 114 Riverton Rd
- 944 Wilbraham Rd
- 130 Spear Rd
- 187 Lamont St
- 381 N Brook Rd
- 150 Seymour Ave
- 18 Riverton Rd
- 30 W Hill Rd
- 46 Puritan Cir
- 54 Seymour Ave
- 195 Almira Rd
Your Personal Tour Guide
Ask me questions while you tour the home.