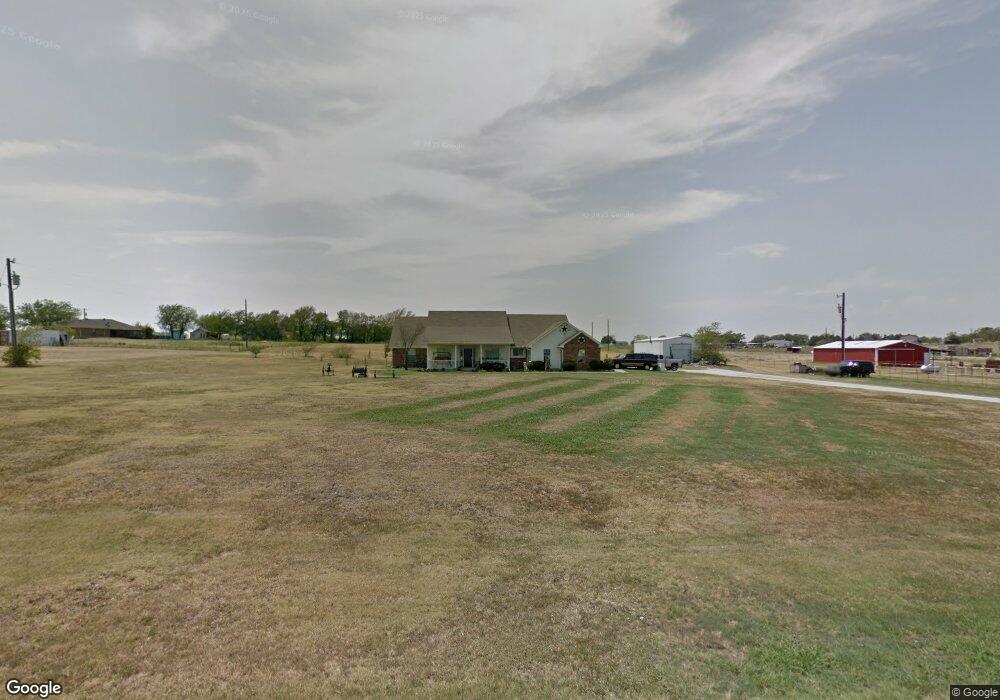
12925 Blakely Ln Sanger, TX 76266
Estimated Value: $492,000 - $639,000
3
Beds
2
Baths
2,067
Sq Ft
$264/Sq Ft
Est. Value
About This Home
This home is located at 12925 Blakely Ln, Sanger, TX 76266 and is currently estimated at $546,460, approximately $264 per square foot. 12925 Blakely Ln is a home located in Denton County with nearby schools including Chisholm Trail Elementary School, Clear Creek Intermediate School, and Sanger Sixth Grade Campus.
Ownership History
Date
Name
Owned For
Owner Type
Purchase Details
Closed on
Aug 15, 2023
Sold by
Mcintire Michael and Mcintire Amanda N
Bought by
Barnhill Noah
Current Estimated Value
Home Financials for this Owner
Home Financials are based on the most recent Mortgage that was taken out on this home.
Original Mortgage
$540,000
Interest Rate
6.81%
Mortgage Type
Construction
Purchase Details
Closed on
May 23, 1996
Sold by
Ervin Glenn and Ervin Wanda Garner
Bought by
Koch Stephen
Purchase Details
Closed on
Jan 10, 1996
Sold by
Thomas Billy Joe and Thomas Carla
Bought by
Koch Stephen Lee and Koch Teressa A
Home Financials for this Owner
Home Financials are based on the most recent Mortgage that was taken out on this home.
Original Mortgage
$103,200
Interest Rate
7.4%
Purchase Details
Closed on
Dec 6, 1995
Sold by
Koch Stephen L and Koch Teressa
Bought by
Shields J W and Shields Mary Elizabeth
Home Financials for this Owner
Home Financials are based on the most recent Mortgage that was taken out on this home.
Original Mortgage
$103,200
Interest Rate
7.4%
Create a Home Valuation Report for This Property
The Home Valuation Report is an in-depth analysis detailing your home's value as well as a comparison with similar homes in the area
Home Values in the Area
Average Home Value in this Area
Purchase History
| Date | Buyer | Sale Price | Title Company |
|---|---|---|---|
| Barnhill Noah | -- | Title Resources | |
| Koch Stephen | -- | -- | |
| Koch Stephen Lee | -- | -- | |
| Shields J W | -- | -- |
Source: Public Records
Mortgage History
| Date | Status | Borrower | Loan Amount |
|---|---|---|---|
| Closed | Barnhill Noah | $540,000 | |
| Previous Owner | Shields J W | $103,200 | |
| Closed | Shields J W | $12,900 |
Source: Public Records
Tax History Compared to Growth
Tax History
| Year | Tax Paid | Tax Assessment Tax Assessment Total Assessment is a certain percentage of the fair market value that is determined by local assessors to be the total taxable value of land and additions on the property. | Land | Improvement |
|---|---|---|---|---|
| 2025 | $542 | $382,328 | $191,733 | $243,700 |
| 2024 | $4,717 | $347,571 | $0 | $0 |
| 2023 | $540 | $315,974 | $191,733 | $306,184 |
| 2022 | $4,764 | $287,249 | $97,333 | $219,189 |
| 2021 | $3,810 | $261,135 | $78,667 | $182,468 |
| 2020 | $4,168 | $265,292 | $78,667 | $186,625 |
| 2019 | $4,193 | $256,182 | $78,667 | $193,012 |
| 2018 | $3,840 | $232,893 | $78,667 | $186,105 |
| 2017 | $3,516 | $211,721 | $78,667 | $165,372 |
| 2016 | $3,196 | $192,474 | $68,000 | $124,474 |
| 2015 | $2,158 | $188,557 | $68,000 | $120,557 |
| 2013 | -- | $182,828 | $57,333 | $125,495 |
Source: Public Records
Map
Nearby Homes
- 8623 Chisum Rd
- 6362 Belz Rd
- 6810 Hunnington Dr
- 6298 Belz Rd
- 12142 Fm 2450
- 7240 Hunnington Dr
- 11087 Chisum Rd
- 921 Waters Edge Dr
- TBD Lois Rd E
- 6000 Fm 455 W
- 5990 Farm To Market 455 W
- TBD Sam Bass Rd W
- Tract 3 Sam Bass Rd
- Tract 2 Sam Bass Rd
- Tract 1 Sam Bass Rd
- 10916 Fm 2450
- TBD Cashs Mill Rd
- 9715 Fm 2450
- 11007 Farm To Market Road 2450
- 000 Fm 2450
- 12935 Blakely Ln
- 12853 Blakely Ln
- 12721 Blakely Ln
- 13127 Blakely Ln
- 13012 Blakely Ln
- 12551 Blakely Ln
- 13167 Blakely Ln
- 12605 Blakely Ln
- 0 Blakely Ln
- 13052 Blakely Ln
- 13080 Blakely Ln
- 13229 Blakely Ln
- 12568 Blakely Ln
- 12500 Blakely Ln
- 13132 Blakely Ln
- 12608 Blakely Ln
- 12476 Blakely Ln
- 12582 Blakely Ln
- 12287 Blakely Ln
- 12265 Blakely Ln