Estimated Value: $155,000 - $178,000
2
Beds
1
Bath
1,274
Sq Ft
$132/Sq Ft
Est. Value
About This Home
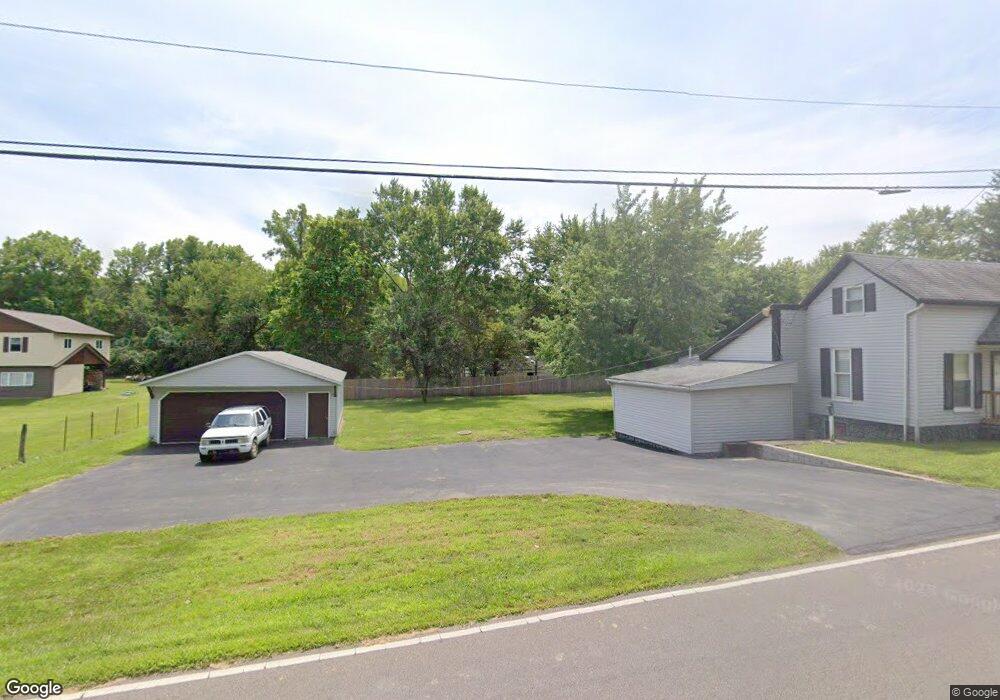
This home is located at 1293 E Main St, Xenia, OH 45385 and is currently estimated at $168,246, approximately $132 per square foot. 1293 E Main St is a home located in Greene County with nearby schools including Xenia High School, Summit Academy Community School for Alternative Learners - Xenia, and Legacy Christian Academy.
Ownership History
Date
Name
Owned For
Owner Type
Purchase Details
Closed on
Jan 18, 2024
Sold by
Mosteller John H
Bought by
Mosteller John and Pardue Christian Patrick
Current Estimated Value
Purchase Details
Closed on
Oct 21, 2021
Sold by
Mosteller John H and Mosteller Elizabeth Kay
Bought by
Mosteller John H and Mosteller Elizabeth Kay
Purchase Details
Closed on
Jul 3, 1997
Sold by
Mosteller John
Bought by
Anderson Alan G
Create a Home Valuation Report for This Property
The Home Valuation Report is an in-depth analysis detailing your home's value as well as a comparison with similar homes in the area
Home Values in the Area
Average Home Value in this Area
Purchase History
| Date | Buyer | Sale Price | Title Company |
|---|---|---|---|
| Mosteller John | -- | None Listed On Document | |
| Mosteller John H | -- | None Available | |
| Anderson Alan G | $3,500 | -- |
Source: Public Records
Tax History
| Year | Tax Paid | Tax Assessment Tax Assessment Total Assessment is a certain percentage of the fair market value that is determined by local assessors to be the total taxable value of land and additions on the property. | Land | Improvement |
|---|---|---|---|---|
| 2024 | $461 | $19,510 | $2,880 | $16,630 |
| 2023 | $461 | $19,510 | $2,880 | $16,630 |
| 2022 | $792 | $15,150 | $2,520 | $12,630 |
| 2021 | $802 | $15,150 | $2,520 | $12,630 |
| 2020 | $422 | $15,150 | $2,520 | $12,630 |
| 2019 | $422 | $7,800 | $2,520 | $5,280 |
| 2018 | $424 | $7,800 | $2,520 | $5,280 |
| 2017 | $448 | $7,800 | $2,520 | $5,280 |
| 2016 | $448 | $8,120 | $2,520 | $5,600 |
| 2015 | $225 | $8,120 | $2,520 | $5,600 |
| 2014 | $216 | $8,120 | $2,520 | $5,600 |
Source: Public Records
Map
Nearby Homes