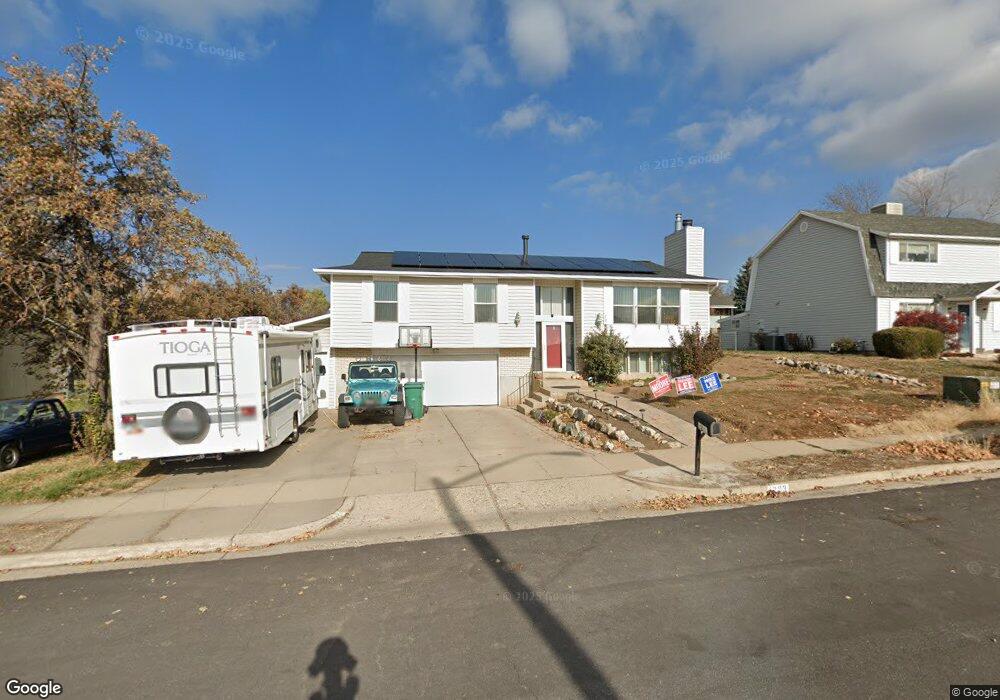
1293 Jeff St Layton, UT 84040
Estimated Value: $451,000 - $478,398
4
Beds
2
Baths
1,811
Sq Ft
$259/Sq Ft
Est. Value
About This Home
This home is located at 1293 Jeff St, Layton, UT 84040 and is currently estimated at $468,600, approximately $258 per square foot. 1293 Jeff St is a home located in Davis County with nearby schools including King Elementary School, Central Davis Junior High School, and Layton High School.
Ownership History
Date
Name
Owned For
Owner Type
Purchase Details
Closed on
May 16, 2012
Sold by
Kimball Melissa and Peterson Melissa
Bought by
Jackson Jeremy and Jackson Tracey
Current Estimated Value
Home Financials for this Owner
Home Financials are based on the most recent Mortgage that was taken out on this home.
Original Mortgage
$8,860
Outstanding Balance
$6,162
Interest Rate
3.98%
Mortgage Type
Stand Alone Second
Estimated Equity
$462,438
Purchase Details
Closed on
Oct 25, 1996
Sold by
Burt Mary Ellen and Reed Donna R
Bought by
Kimball Sean G and Kimball Melissa
Home Financials for this Owner
Home Financials are based on the most recent Mortgage that was taken out on this home.
Original Mortgage
$110,200
Interest Rate
8.11%
Create a Home Valuation Report for This Property
The Home Valuation Report is an in-depth analysis detailing your home's value as well as a comparison with similar homes in the area
Home Values in the Area
Average Home Value in this Area
Purchase History
| Date | Buyer | Sale Price | Title Company |
|---|---|---|---|
| Jackson Jeremy | -- | Backman Title Servic | |
| Jackson Jeremy | -- | Backman Title Servic | |
| Kimball Sean G | -- | U S Title |
Source: Public Records
Mortgage History
| Date | Status | Borrower | Loan Amount |
|---|---|---|---|
| Open | Jackson Jeremy | $8,860 | |
| Open | Jackson Jeremy | $152,192 | |
| Closed | Jackson Jeremy | $152,192 | |
| Previous Owner | Kimball Sean G | $110,200 |
Source: Public Records
Tax History Compared to Growth
Tax History
| Year | Tax Paid | Tax Assessment Tax Assessment Total Assessment is a certain percentage of the fair market value that is determined by local assessors to be the total taxable value of land and additions on the property. | Land | Improvement |
|---|---|---|---|---|
| 2025 | $2,285 | $239,800 | $118,147 | $121,653 |
| 2024 | $2,195 | $232,100 | $143,037 | $89,063 |
| 2023 | $2,157 | $402,000 | $195,288 | $206,712 |
| 2022 | $2,266 | $229,350 | $104,537 | $124,813 |
| 2021 | $2,100 | $317,000 | $158,754 | $158,246 |
| 2020 | $1,809 | $262,000 | $127,193 | $134,807 |
| 2019 | $1,777 | $252,000 | $113,913 | $138,087 |
| 2018 | $1,643 | $234,000 | $87,635 | $146,365 |
| 2016 | $1,421 | $104,390 | $46,342 | $58,048 |
| 2015 | $1,367 | $95,315 | $46,342 | $48,973 |
| 2014 | $1,340 | $95,528 | $46,342 | $49,186 |
| 2013 | -- | $92,303 | $22,748 | $69,555 |
Source: Public Records
Map
Nearby Homes
- 1884 Nalder St
- 1281 E South Lisa St
- 1122 E 1250 N
- 1340 E Hollyhock Way
- Richards Plan at Eastridge Park - The Vistas
- Brynlee Plan at Eastridge Park - The Vistas
- Brynlee Plan at Eastridge Park - The Heights
- Ontario Plan at Eastridge Park - The Heights
- Mclauren Plan at Eastridge Park - The Vistas
- Escher Plan at Eastridge Park - The Vistas
- Rivershore Plan at Eastridge Park - The Vistas
- Helene Plan at Eastridge Park - The Vistas
- Bromley Plan at Eastridge Park - The Heights
- Beringwood Plan at Eastridge Park - The Heights
- Caulfield Plan at Eastridge Park - The Heights
- Hawthorne Plan at Eastridge Park - The Heights
- Kimbrough Plan at Eastridge Park - The Vistas
- Cedarbark Plan at Eastridge Park - The Heights
- 1252 E Larkspur Way
- 1266 E Larkspur Way
- 1277 Jeff St
- 1305 Jeff St
- 1718 Nalder St
- 1920 Nalder St
- 1286 E South Lisa St
- 1278 E South Lisa St
- 1298 E South Lisa St
- 1278 E South Lisa St
- 1278 E 1325 N
- 1278 S Lisa St
- 1323 E 1275 N
- 1296 Jeff St
- 1323 Jeff St
- 1261 Jeff St
- 1323 Jeff St
- 1260 Nalder St
- 1256 E South Lisa St
- 1251 Nalder St
- 1251 N 1300 E
- 1312 N East Lisa St