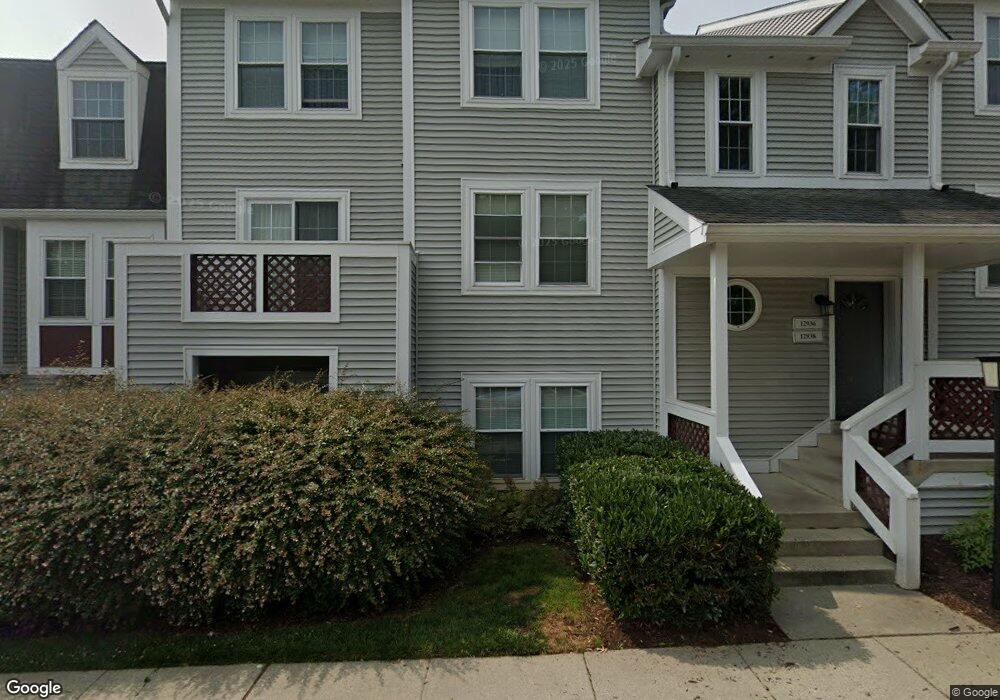
12936 Grays Pointe Rd Unit 12936A Fairfax, VA 22033
Estimated Value: $361,000 - $372,000
2
Beds
2
Baths
1,018
Sq Ft
$360/Sq Ft
Est. Value
About This Home
This home is located at 12936 Grays Pointe Rd Unit 12936A, Fairfax, VA 22033 and is currently estimated at $366,305, approximately $359 per square foot. 12936 Grays Pointe Rd Unit 12936A is a home located in Fairfax County with nearby schools including Greenbriar East Elementary School, Rocky Run Middle School, and Chantilly High School.
Ownership History
Date
Name
Owned For
Owner Type
Purchase Details
Closed on
Aug 10, 2017
Sold by
Fitzkee Toby and Fitzkee Helen C
Bought by
Kurtz Russell J
Current Estimated Value
Home Financials for this Owner
Home Financials are based on the most recent Mortgage that was taken out on this home.
Original Mortgage
$211,500
Outstanding Balance
$113,114
Interest Rate
3.96%
Mortgage Type
New Conventional
Estimated Equity
$253,191
Purchase Details
Closed on
Nov 16, 2009
Sold by
Fitzkee Toby
Bought by
Fitzkee Toby
Purchase Details
Closed on
Jul 29, 2005
Sold by
Horn Lee S C
Bought by
Fitzkee Toby and Vargas Bernice
Home Financials for this Owner
Home Financials are based on the most recent Mortgage that was taken out on this home.
Original Mortgage
$272,000
Interest Rate
5.67%
Mortgage Type
New Conventional
Create a Home Valuation Report for This Property
The Home Valuation Report is an in-depth analysis detailing your home's value as well as a comparison with similar homes in the area
Home Values in the Area
Average Home Value in this Area
Purchase History
| Date | Buyer | Sale Price | Title Company |
|---|---|---|---|
| Kurtz Russell J | $235,000 | Rgs Title Llc | |
| Fitzkee Toby | -- | -- | |
| Fitzkee Toby | $340,000 | -- |
Source: Public Records
Mortgage History
| Date | Status | Borrower | Loan Amount |
|---|---|---|---|
| Open | Kurtz Russell J | $211,500 | |
| Previous Owner | Fitzkee Toby | $272,000 |
Source: Public Records
Tax History Compared to Growth
Tax History
| Year | Tax Paid | Tax Assessment Tax Assessment Total Assessment is a certain percentage of the fair market value that is determined by local assessors to be the total taxable value of land and additions on the property. | Land | Improvement |
|---|---|---|---|---|
| 2025 | $3,896 | $349,730 | $70,000 | $279,730 |
| 2024 | $3,896 | $336,280 | $67,000 | $269,280 |
| 2023 | $3,482 | $308,510 | $62,000 | $246,510 |
| 2022 | $3,392 | $296,640 | $59,000 | $237,640 |
| 2021 | $3,165 | $269,670 | $54,000 | $215,670 |
| 2020 | $2,875 | $242,950 | $49,000 | $193,950 |
| 2019 | $2,819 | $238,150 | $48,000 | $190,150 |
| 2018 | $2,632 | $228,840 | $46,000 | $182,840 |
| 2017 | $2,712 | $233,570 | $47,000 | $186,570 |
| 2016 | $2,600 | $224,390 | $45,000 | $179,390 |
| 2015 | $2,504 | $224,390 | $45,000 | $179,390 |
| 2014 | $2,192 | $196,830 | $39,000 | $157,830 |
Source: Public Records
Map
Nearby Homes
- 12975 Ridgemist Ln
- 4107 Mount Echo Ln
- 4111 Mount Echo Ln
- 4001 Middle Ridge Dr
- 13116 Penndale Ln
- 13102 Pennypacker Ln
- 12801 Point Pleasant Dr
- 12798 Fox Keep Run
- 3814 Highland Oaks Dr
- 4303 Markwood Ln
- 4403 Moylan Ln
- 4427 Majestic Ln
- 4319 Markwood Ln
- 4506 Superior Square
- 4528 Superior Square
- 12912 Fair Briar Ln
- 12737 Fair Briar Ln
- 12805 Fair Briar Ln
- 12845 Fair Briar Ln
- 12855 Fair Briar Ln
- 12928 Grays Pointe Rd
- 12930 Grays Pointe Rd Unit 12930A
- 12930 Grays Pointe Rd Unit C
- 12942 Grays Pointe Rd
- 12936 Grays Pointe Rd Unit A
- 12938 Grays Pointe Rd Unit B
- 12932 Grays Pointe Rd Unit B
- 12936 Grays Pointe Rd Unit 36B
- 12934 Grays Pointe Rd Unit B
- 12938 Grays Pointe Rd Unit 12938A
- 12938 Grays Pointe Rd Unit 12938C
- 12938 Grays Pointe Rd Unit 38C
- 12934 Grays Pointe Rd Unit 12934B
- 12930 Grays Pointe Rd Unit 12930C
- 12944 Grays Pointe Rd Unit C
- 12932 Grays Pointe Rd Unit 12932B
- 12944 Grays Pointe Rd
- 12934 Grays Pointe Rd Unit 12934A
- 12944 Grays Pointe Rd Unit 12944A
- 12944 Grays Pointe Rd Unit 12944C