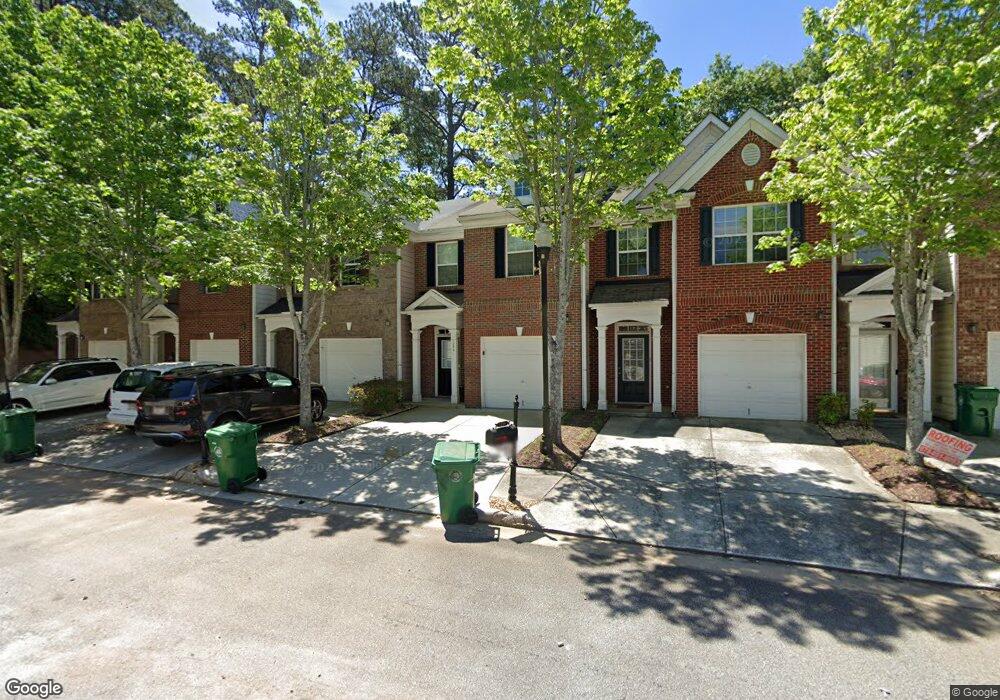
1294 Adcox Square Stone Mountain, GA 30088
Estimated Value: $226,000 - $253,000
3
Beds
3
Baths
1,736
Sq Ft
$139/Sq Ft
Est. Value
About This Home
This home is located at 1294 Adcox Square, Stone Mountain, GA 30088 and is currently estimated at $240,946, approximately $138 per square foot. 1294 Adcox Square is a home located in DeKalb County with nearby schools including Woodridge Elementary School, Miller Grove Middle School, and Miller Grove High School.
Ownership History
Date
Name
Owned For
Owner Type
Purchase Details
Closed on
Aug 23, 2017
Sold by
2016A Property Owner Llc
Bought by
Tah 2017 1 Borrower Llc and C/O Tricon American Homes Llc
Current Estimated Value
Purchase Details
Closed on
Jan 14, 2016
Sold by
Mcf Asset Holdings Lp
Bought by
Mcf Sfr Holdings 1 Llc
Purchase Details
Closed on
Nov 3, 2015
Sold by
Moore Tyeisha
Bought by
Mcf Asset Holdings Lp
Purchase Details
Closed on
Oct 26, 2010
Sold by
Bac Home Loans Servicing Lp
Bought by
Moore Tyeisha
Home Financials for this Owner
Home Financials are based on the most recent Mortgage that was taken out on this home.
Original Mortgage
$71,650
Interest Rate
4.25%
Mortgage Type
FHA
Purchase Details
Closed on
May 4, 2010
Sold by
Wanyandeh Charles
Bought by
Bac Hm Lns Svcng Lp
Purchase Details
Closed on
Mar 25, 2005
Sold by
Bowen Fam Homes Inc
Bought by
Wanyandeh Charles
Home Financials for this Owner
Home Financials are based on the most recent Mortgage that was taken out on this home.
Original Mortgage
$107,300
Interest Rate
6.38%
Mortgage Type
New Conventional
Create a Home Valuation Report for This Property
The Home Valuation Report is an in-depth analysis detailing your home's value as well as a comparison with similar homes in the area
Home Values in the Area
Average Home Value in this Area
Purchase History
| Date | Buyer | Sale Price | Title Company |
|---|---|---|---|
| Tah 2017 1 Borrower Llc | -- | -- | |
| Mcf Sfr Holdings 1 Llc | -- | -- | |
| Mcf Asset Holdings Lp | -- | -- | |
| Moore Tyeisha | $73,000 | -- | |
| Bac Hm Lns Svcng Lp | $67,000 | -- | |
| Wanyandeh Charles | $134,200 | -- |
Source: Public Records
Mortgage History
| Date | Status | Borrower | Loan Amount |
|---|---|---|---|
| Previous Owner | Moore Tyeisha | $71,650 | |
| Previous Owner | Wanyandeh Charles | $107,300 |
Source: Public Records
Tax History Compared to Growth
Tax History
| Year | Tax Paid | Tax Assessment Tax Assessment Total Assessment is a certain percentage of the fair market value that is determined by local assessors to be the total taxable value of land and additions on the property. | Land | Improvement |
|---|---|---|---|---|
| 2025 | $5,049 | $105,280 | $20,003 | $85,277 |
| 2024 | $5,023 | $105,280 | $20,000 | $85,280 |
| 2023 | $5,023 | $101,160 | $20,000 | $81,160 |
| 2022 | $3,306 | $68,200 | $7,400 | $60,800 |
| 2021 | $2,992 | $61,040 | $7,400 | $53,640 |
| 2020 | $2,421 | $48,040 | $7,400 | $40,640 |
| 2019 | $2,386 | $47,240 | $7,400 | $39,840 |
| 2018 | $1,436 | $39,040 | $7,400 | $31,640 |
| 2017 | $1,883 | $35,600 | $7,400 | $28,200 |
| 2016 | $1,704 | $31,480 | $7,400 | $24,080 |
| 2014 | $824 | $26,280 | $7,400 | $18,880 |
Source: Public Records
Map
Nearby Homes
- 1246 Adcox Square
- 1248 Tyne Way Unit 1
- 4821 Mainstreet Valley Trace
- 4817 Mainstreet Valley Trace
- 4962 Redan Rd
- 1126 Mainstreet Valley Dr
- 1139 Mainstreet Valley Dr
- 1323 S Hairston Rd
- 1337 S Hairston Rd
- 4812 White Oak Path Unit 1
- 1159 Village Main St
- 4871 Pinnacle Dr
- 4867 Pinnacle Dr
- 1121 Village Main St
- 4981 Millstone Walk
- 4831 Oak Path
- 1086 Village Rd
- 4927 Millstone Walk
- 1088 Nimblewood Way
- 4594 Bexley Dr
- 1296 Adcox Square
- 1296 Adcox Square Unit 1296
- 1294 Adcox Square
- 1298 Adcox Square Unit 34
- 1298 Adcox Square
- 1298 Adcox Square
- 1300 Adcox Square
- 1300 Adcox Square
- 1292 Adcox Square
- 1302 Adcox Square Unit 36
- 1288 Adcox Square
- 1306 Adcox Square
- 1308 Adcox Square Unit 38
- 1284 Adcox Square
- 1284 Adcox Square Unit 1284
- 1301 Adcox Square
- 1301 Adcox Square
- 4800 Fenbrook Dr Unit 1
- 1310 Adcox Square
- 4804 Fenbrook Dr