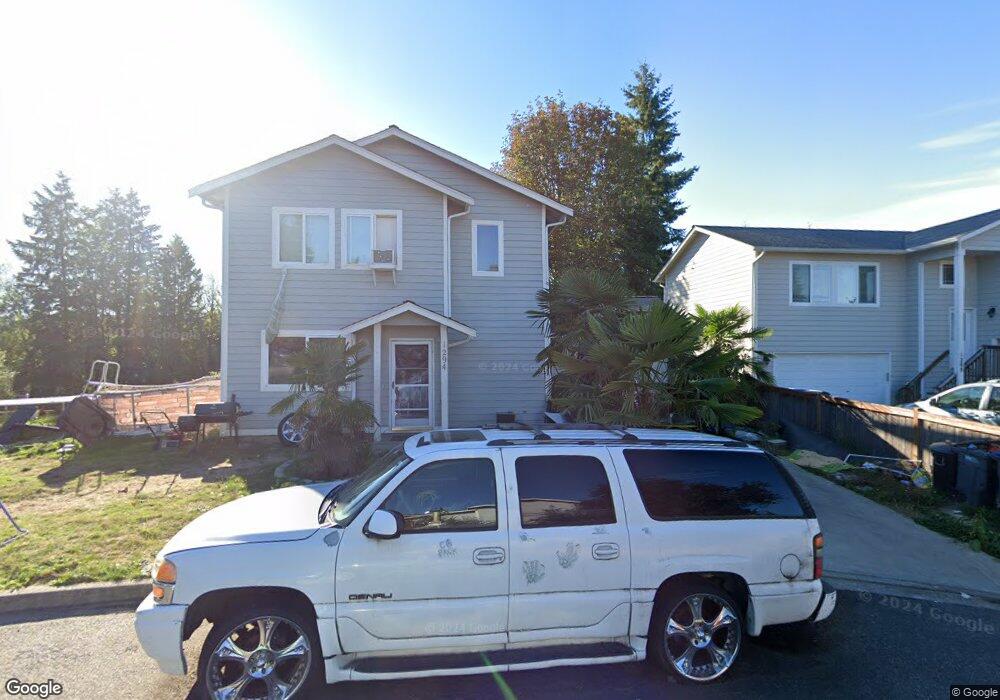
1294 SE Casandra Loop Port Orchard, WA 98366
Estimated Value: $413,000 - $452,000
3
Beds
2
Baths
1,216
Sq Ft
$356/Sq Ft
Est. Value
About This Home
This home is located at 1294 SE Casandra Loop, Port Orchard, WA 98366 and is currently estimated at $432,636, approximately $355 per square foot. 1294 SE Casandra Loop is a home with nearby schools including East Port Orchard Elementary School, Marcus Whitman Middle School, and South Kitsap High School.
Ownership History
Date
Name
Owned For
Owner Type
Purchase Details
Closed on
May 24, 2010
Sold by
Kitsap County Consolidated Housing Autho
Bought by
Filer Brittney A
Current Estimated Value
Home Financials for this Owner
Home Financials are based on the most recent Mortgage that was taken out on this home.
Original Mortgage
$184,200
Outstanding Balance
$146,794
Interest Rate
5.03%
Mortgage Type
Purchase Money Mortgage
Estimated Equity
$285,842
Purchase Details
Closed on
May 19, 2010
Sold by
Grice Corporation
Bought by
Kitsap County Consolidated Housing Autho
Home Financials for this Owner
Home Financials are based on the most recent Mortgage that was taken out on this home.
Original Mortgage
$184,200
Outstanding Balance
$146,794
Interest Rate
5.03%
Mortgage Type
Purchase Money Mortgage
Estimated Equity
$285,842
Create a Home Valuation Report for This Property
The Home Valuation Report is an in-depth analysis detailing your home's value as well as a comparison with similar homes in the area
Home Values in the Area
Average Home Value in this Area
Purchase History
| Date | Buyer | Sale Price | Title Company |
|---|---|---|---|
| Filer Brittney A | -- | Pacific Nw Title | |
| Kitsap County Consolidated Housing Autho | $975,280 | Pacific Nw Title |
Source: Public Records
Mortgage History
| Date | Status | Borrower | Loan Amount |
|---|---|---|---|
| Open | Filer Brittney A | $184,200 |
Source: Public Records
Tax History Compared to Growth
Tax History
| Year | Tax Paid | Tax Assessment Tax Assessment Total Assessment is a certain percentage of the fair market value that is determined by local assessors to be the total taxable value of land and additions on the property. | Land | Improvement |
|---|---|---|---|---|
| 2026 | $3,297 | $380,400 | $70,260 | $310,140 |
| 2025 | $3,297 | $377,780 | $64,460 | $313,320 |
| 2024 | $3,182 | $377,780 | $64,460 | $313,320 |
| 2023 | $3,180 | $377,780 | $64,460 | $313,320 |
| 2022 | $3,108 | $310,850 | $60,200 | $250,650 |
| 2021 | $2,646 | $250,840 | $55,940 | $194,900 |
| 2020 | $2,603 | $239,310 | $53,270 | $186,040 |
| 2019 | $2,116 | $212,970 | $52,320 | $160,650 |
| 2018 | $2,233 | $158,220 | $47,560 | $110,660 |
| 2017 | $1,734 | $158,220 | $47,560 | $110,660 |
| 2016 | $1,689 | $142,670 | $47,560 | $95,110 |
| 2015 | $1,630 | $139,930 | $47,560 | $92,370 |
| 2014 | -- | $138,100 | $47,560 | $90,540 |
| 2013 | -- | $149,830 | $50,060 | $99,770 |
Source: Public Records
Map
Nearby Homes
- 1350 SE Shelton Ln
- 1450 Bill Ave
- 1401 Sidney Ave
- 1336 Sidney Ave
- 3922 Bethel Rd SE
- 1325 Garrison Ave
- 1 SE Salmonberry Rd
- 517 Forrest Park St
- 1632 SE Salmonberry Rd
- 527 Radey St
- 1109 Garrison Ave
- 1743 SE Crawford Rd
- 4275 Acacia Ln SE
- 703 Melcher St
- 2723 Lincoln Ave SE
- 1932 SE Salmonberry Rd
- 4278 Acacia Ln SE
- 2315 SE Kelby Cir
- 280 Flower Meadows St
- 155 May St W
- 1288 SE Casandra Loop
- 1301 SE Casandra Loop
- 1277 SE Casandra Loop
- 1300 SE Casandra Loop
- 1271 SE Casandra Loop
- 1307 SE Casandra Loop
- 1307 Casandra Loop
- 1282 SE Casandra Loop
- 1306 SE Casandra Loop
- 1276 Casandra Loop
- 1313 SE Casandra Loop
- 1265 SE Casandra Loop
- 1265 Casandra Loop
- 1270 SE Casandra Loop
- 1327 SE Carl Pickel Dr
- 1312 SE Casandra Loop
- 1319 SE Casandra Loop
- 1264 SE Casandra Loop
- 1259 SE Casandra Loop