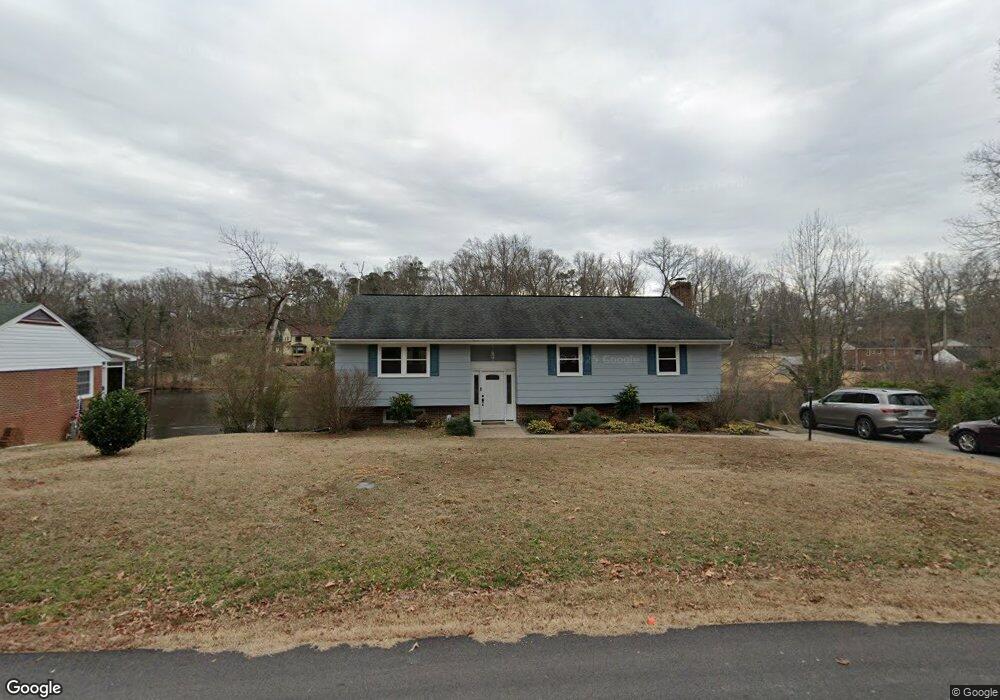
12941 Erlene Dr Chester, VA 23831
Estimated Value: $395,000 - $410,000
4
Beds
3
Baths
2,593
Sq Ft
$155/Sq Ft
Est. Value
About This Home
This home is located at 12941 Erlene Dr, Chester, VA 23831 and is currently estimated at $403,090, approximately $155 per square foot. 12941 Erlene Dr is a home located in Chesterfield County with nearby schools including C.C. Wells Elementary School, George W. Carver Middle School, and Lloyd C Bird High School.
Ownership History
Date
Name
Owned For
Owner Type
Purchase Details
Closed on
Jul 14, 2022
Sold by
Neal Morris Ii Lynwood
Bought by
Lynwood Neal Morris Ii Trust
Current Estimated Value
Purchase Details
Closed on
Oct 12, 2006
Sold by
Lee Ryamond
Bought by
Morris Lynwood
Home Financials for this Owner
Home Financials are based on the most recent Mortgage that was taken out on this home.
Original Mortgage
$191,250
Interest Rate
6.49%
Mortgage Type
New Conventional
Purchase Details
Closed on
May 23, 2006
Sold by
Walsh Norman
Bought by
Lee Raymond
Home Financials for this Owner
Home Financials are based on the most recent Mortgage that was taken out on this home.
Original Mortgage
$164,800
Interest Rate
6.55%
Mortgage Type
New Conventional
Create a Home Valuation Report for This Property
The Home Valuation Report is an in-depth analysis detailing your home's value as well as a comparison with similar homes in the area
Home Values in the Area
Average Home Value in this Area
Purchase History
| Date | Buyer | Sale Price | Title Company |
|---|---|---|---|
| Lynwood Neal Morris Ii Trust | -- | Maxwell Scott K | |
| Lynwood Neal Morris Ii Trust | -- | Maxwell Scott K | |
| Morris Lynwood | $255,000 | -- | |
| Lee Raymond | $206,000 | -- |
Source: Public Records
Mortgage History
| Date | Status | Borrower | Loan Amount |
|---|---|---|---|
| Previous Owner | Morris Lynwood | $191,250 | |
| Previous Owner | Lee Raymond | $164,800 |
Source: Public Records
Tax History
| Year | Tax Paid | Tax Assessment Tax Assessment Total Assessment is a certain percentage of the fair market value that is determined by local assessors to be the total taxable value of land and additions on the property. | Land | Improvement |
|---|---|---|---|---|
| 2025 | $3,068 | $341,900 | $93,000 | $248,900 |
| 2024 | $3,068 | $327,600 | $91,000 | $236,600 |
| 2023 | $2,713 | $298,100 | $91,000 | $207,100 |
| 2022 | $2,496 | $271,300 | $81,000 | $190,300 |
| 2021 | $2,496 | $255,800 | $78,000 | $177,800 |
| 2020 | $2,347 | $247,100 | $77,000 | $170,100 |
| 2019 | $2,272 | $239,200 | $77,000 | $162,200 |
| 2018 | $2,239 | $235,700 | $76,000 | $159,700 |
| 2017 | $2,130 | $221,900 | $76,000 | $145,900 |
| 2016 | $2,057 | $214,300 | $76,000 | $138,300 |
| 2015 | $2,083 | $214,400 | $76,000 | $138,400 |
| 2014 | $2,078 | $213,900 | $76,000 | $137,900 |
Source: Public Records
Map
Nearby Homes
- 13012 Harrowgate Rd
- 13101 Harrowgate Rd
- 4614 Crossgate Rd
- 12704 Kelsey Pointe Ct
- 13335 Happy Hill Rd
- 4727 Rieves Pond Dr
- 13225 Old Happy Hill Rd
- 4331 Poplar Village Dr
- 4324 Poplar Village Dr
- 3923 Cresthill Rd
- 4313 Poplar Village Dr
- 12606 Poplar Village Place
- 12618 Poplar Village Place
- 4306 Poplar Village Dr
- 4248 Poplar Village Dr
- 12601 Poplar Village Place
- 12607 Poplar Village Place
- 4230 Poplar Village Dr
- 4212 Poplar Village Dr
- 4101 Sunset Ave
- 12947 Erlene Dr
- 12948 Erlene Dr
- 12929 Erlene Dr
- 12934 Erlene Dr
- 12951 Erlene Dr
- 4314 Erlene Ct
- 13001 Hollis Rd
- 12921 Harrowgate Rd
- 12926 Erlene Dr
- 12955 Erlene Dr
- 12923 Erlene Dr
- 13007 Harrowgate Rd
- 12915 Harrowgate Rd
- 13000 Hollis Rd
- 12920 Erlene Dr
- 13013 Harrowgate Rd
- 12917 Erlene Dr
- 12909 Harrowgate Rd
- 13003 Hollis Rd
- 13019 Harrowgate Rd
Your Personal Tour Guide
Ask me questions while you tour the home.