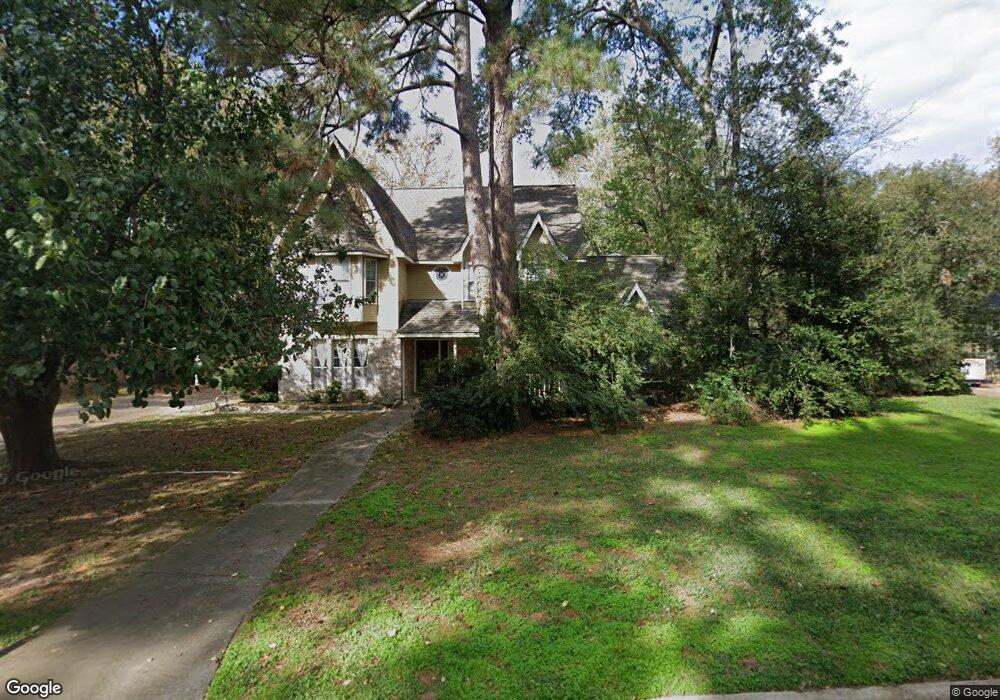
12942 Wincrest Ct Cypress, TX 77429
Estimated Value: $384,531 - $421,000
4
Beds
3
Baths
2,814
Sq Ft
$143/Sq Ft
Est. Value
About This Home
This home is located at 12942 Wincrest Ct, Cypress, TX 77429 and is currently estimated at $402,383, approximately $142 per square foot. 12942 Wincrest Ct is a home located in Harris County with nearby schools including Hamilton Elementary School, Hamilton Middle School, and Cypress Creek High School.
Ownership History
Date
Name
Owned For
Owner Type
Purchase Details
Closed on
Mar 17, 2020
Sold by
Clay David
Bought by
Clay Teresa L
Current Estimated Value
Purchase Details
Closed on
Apr 7, 2005
Sold by
Bailey Larry L and Bailey Judith K
Bought by
Clay David
Home Financials for this Owner
Home Financials are based on the most recent Mortgage that was taken out on this home.
Original Mortgage
$136,000
Outstanding Balance
$72,536
Interest Rate
6.3%
Mortgage Type
Fannie Mae Freddie Mac
Estimated Equity
$329,847
Purchase Details
Closed on
Sep 16, 1997
Sold by
Moore Warren K
Bought by
Bailey Larry L and Bailey Judith K
Home Financials for this Owner
Home Financials are based on the most recent Mortgage that was taken out on this home.
Original Mortgage
$125,150
Interest Rate
7.48%
Create a Home Valuation Report for This Property
The Home Valuation Report is an in-depth analysis detailing your home's value as well as a comparison with similar homes in the area
Home Values in the Area
Average Home Value in this Area
Purchase History
| Date | Buyer | Sale Price | Title Company |
|---|---|---|---|
| Clay Teresa L | -- | None Available | |
| Clay David | -- | Chicago Title Insurance Comp | |
| Bailey Larry L | -- | Commonwealth Land Title Co |
Source: Public Records
Mortgage History
| Date | Status | Borrower | Loan Amount |
|---|---|---|---|
| Open | Clay David | $136,000 | |
| Previous Owner | Bailey Larry L | $125,150 | |
| Closed | Clay David | $34,000 |
Source: Public Records
Tax History Compared to Growth
Tax History
| Year | Tax Paid | Tax Assessment Tax Assessment Total Assessment is a certain percentage of the fair market value that is determined by local assessors to be the total taxable value of land and additions on the property. | Land | Improvement |
|---|---|---|---|---|
| 2025 | $1,198 | $354,643 | $83,950 | $270,693 |
| 2024 | $1,198 | $342,338 | $83,950 | $258,388 |
| 2023 | $1,198 | $370,000 | $83,950 | $286,050 |
| 2022 | $6,266 | $305,000 | $70,150 | $234,850 |
| 2021 | $6,855 | $271,846 | $70,150 | $201,696 |
| 2020 | $6,906 | $265,504 | $54,050 | $211,454 |
| 2019 | $6,942 | $257,202 | $44,275 | $212,927 |
| 2018 | $1,205 | $257,202 | $44,275 | $212,927 |
| 2017 | $6,931 | $257,202 | $44,275 | $212,927 |
| 2016 | $6,516 | $257,202 | $44,275 | $212,927 |
| 2015 | $2,251 | $249,718 | $44,275 | $205,443 |
| 2014 | $2,251 | $205,624 | $29,325 | $176,299 |
Source: Public Records
Map
Nearby Homes
- 13018 Wincrest Ct
- 12903 Cluster Pine Dr
- 12906 Ivyforest Dr
- 13012 Kathy Ln
- 13114 Kathy Ln
- 13206 Chriswood Dr
- 13210 Chriswood Dr
- 13206 Vinca Ct
- 51 Wincrest Falls Dr
- 12610 Ivyforest Dr
- 12923 Hunterfield Dr
- 12422 Hammersmith Dr
- 13302 Autumn Valley Dr
- 12502 Wealdstone Dr
- 13219 Allysum Ct
- 12915 Hunterfield Dr
- 12407 Wealdstone Dr
- 13119 Rosewood Glen Dr
- 12854 Highland Hills Dr
- 13307 Cypress Pond Dr
- 12946 Wincrest Ct
- 12927 Elmington Dr
- 13002 Wincrest Ct
- 12923 Elmington Dr
- 12951 Wincrest Ct
- 13003 Elmington Dr
- 12955 Wincrest Ct
- 12947 Wincrest Ct
- 12950 Wincrest Ct
- 13006 Wincrest Ct
- 13003 Wincrest Ct
- 12943 Wincrest Ct
- 12919 Elmington Dr
- 13007 Elmington Dr
- 13007 Wincrest Ct
- 12939 Wincrest Ct
- 13010 Wincrest Ct
- 13006 Marron Dr
- 12930 Elmington Dr
- 12926 Elmington Dr