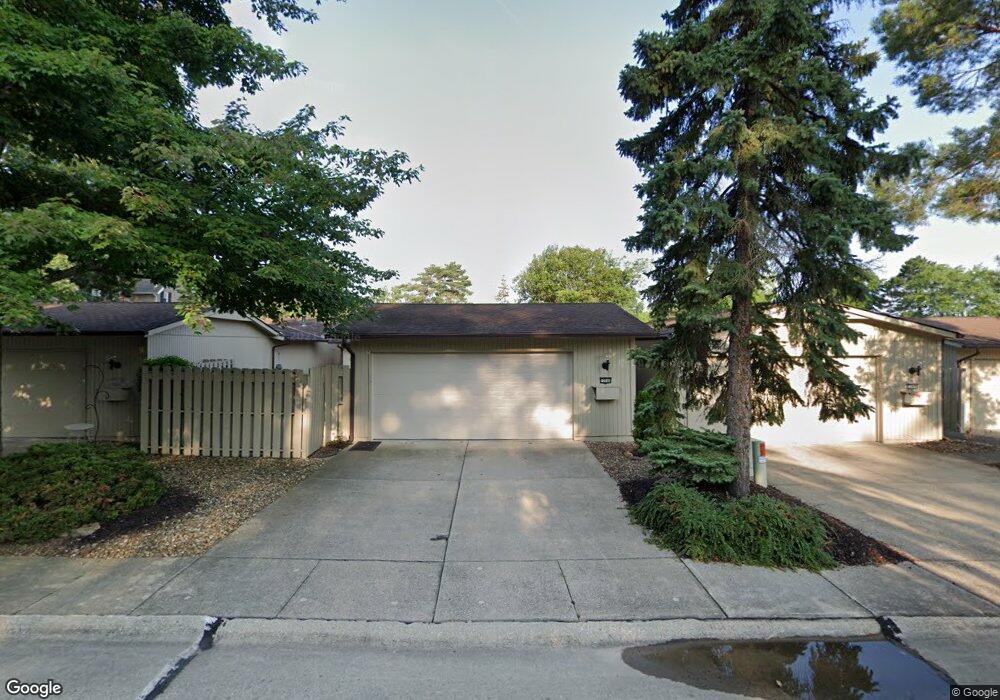
12946 Dell Ridge Ct Unit 7031 Strongsville, OH 44149
Estimated Value: $227,000 - $255,000
2
Beds
2
Baths
1,200
Sq Ft
$200/Sq Ft
Est. Value
About This Home
This home is located at 12946 Dell Ridge Ct Unit 7031, Strongsville, OH 44149 and is currently estimated at $239,954, approximately $199 per square foot. 12946 Dell Ridge Ct Unit 7031 is a home located in Cuyahoga County with nearby schools including Strongsville High School, Strongsville Academy, and Sts Joseph & John Interparochial School.
Ownership History
Date
Name
Owned For
Owner Type
Purchase Details
Closed on
Sep 26, 2017
Sold by
Taylor John P and Taylor Barbara J
Bought by
Williamson Suzette
Current Estimated Value
Home Financials for this Owner
Home Financials are based on the most recent Mortgage that was taken out on this home.
Original Mortgage
$62,500
Outstanding Balance
$34,044
Interest Rate
3.89%
Mortgage Type
New Conventional
Estimated Equity
$205,910
Purchase Details
Closed on
May 28, 2009
Sold by
Kraus Raymond Howard and Kraus Elaine
Bought by
Taylor John P and Taylor Barbara J
Purchase Details
Closed on
Aug 11, 1992
Sold by
Kraus Lawerence C
Bought by
Kraus Lawrence C
Purchase Details
Closed on
Feb 2, 1987
Sold by
Heil Barbara Ann
Bought by
Kraus Lawerence C
Purchase Details
Closed on
May 31, 1979
Sold by
Borch Einar A and Borch Dorothy W
Bought by
Heil Barbara Ann
Purchase Details
Closed on
Jan 1, 1975
Bought by
Borch Einar A and Borch Dorothy W
Create a Home Valuation Report for This Property
The Home Valuation Report is an in-depth analysis detailing your home's value as well as a comparison with similar homes in the area
Home Values in the Area
Average Home Value in this Area
Purchase History
| Date | Buyer | Sale Price | Title Company |
|---|---|---|---|
| Williamson Suzette | $137,000 | Chicago Title | |
| Taylor John P | $89,000 | Landcastle Title Llc | |
| Kraus Lawrence C | -- | -- | |
| Kraus Lawerence C | $78,000 | -- | |
| Heil Barbara Ann | $70,000 | -- | |
| Borch Einar A | -- | -- |
Source: Public Records
Mortgage History
| Date | Status | Borrower | Loan Amount |
|---|---|---|---|
| Open | Williamson Suzette | $62,500 |
Source: Public Records
Tax History Compared to Growth
Tax History
| Year | Tax Paid | Tax Assessment Tax Assessment Total Assessment is a certain percentage of the fair market value that is determined by local assessors to be the total taxable value of land and additions on the property. | Land | Improvement |
|---|---|---|---|---|
| 2024 | $3,223 | $68,635 | $6,860 | $61,775 |
| 2023 | $3,877 | $61,920 | $6,200 | $55,720 |
| 2022 | $3,849 | $61,920 | $6,200 | $55,720 |
| 2021 | $3,819 | $61,920 | $6,200 | $55,720 |
| 2020 | $3,269 | $46,900 | $4,690 | $42,210 |
| 2019 | $3,173 | $134,000 | $13,400 | $120,600 |
| 2018 | $2,880 | $46,900 | $4,690 | $42,210 |
| 2017 | $1,247 | $27,550 | $3,430 | $24,120 |
| 2016 | $1,237 | $27,550 | $3,430 | $24,120 |
| 2015 | $1,393 | $27,550 | $3,430 | $24,120 |
| 2014 | $1,393 | $29,620 | $3,680 | $25,940 |
Source: Public Records
Map
Nearby Homes
- 19767 Dell Dr
- 19982 Westwood Dr
- 12694 Ionia Ct
- 12647 Edgepark Cir
- 13066 Olympus Way
- 12539 Olympus Way
- 12385 Corinth Ct
- 13156 Olympus Way
- 13099 Olympus Way
- 13237 Tomson Dr
- 13236 Tomson Dr
- 12651 Alameda Dr
- 20469 Westwood Park Blvd
- 14112 Settlers Way
- 19620 Porters Ln Unit 15F
- 19160 Wheelers Ln
- 20078 Trapper Trail
- 11499 Pearl Rd Unit A106
- 11479 Pearl Rd Unit A101
- 11432 Pearl Rd
- 19853 Dell Dr Unit 7035
- 19841 Dell Dr Unit 7034
- 12902 Dell Ridge Ct Unit 7033
- 19863 Dell Dr Unit 7037
- 19859 Dell Dr
- 12960 Dell Ridge Ct
- 12919 Dell Ridge Ct
- 12919 Dell Ridge Ct Unit 7029
- 19888 Westwood Dr
- 12903 Dell Ridge Ct Unit 7028
- 19842 Dell Dr Unit 7005
- 19850 Dell Dr
- 19858 Dell Dr
- 19842 Dell Dr Unit 7
- 19850 Dell Dr Unit 7004
- 19858 Dell Dr Unit 7003
- 12891 Dell Ridge Ct Unit 7027
- 19858 Westwood Dr
- 19864 Dell Dr Unit 7002