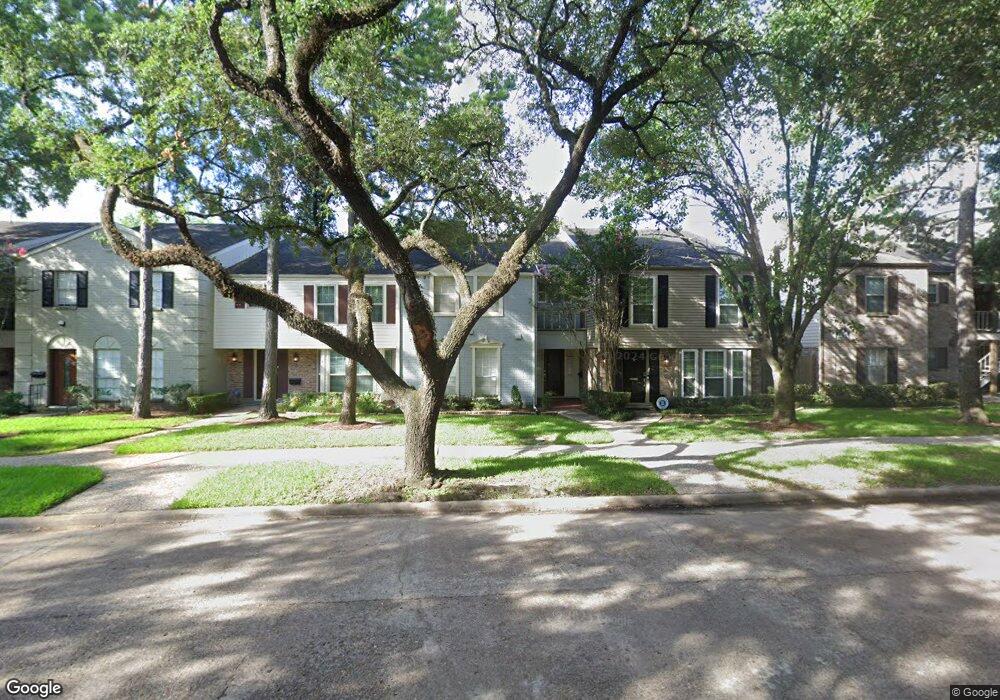
12949 Trail Hollow Dr Unit 6 Houston, TX 77079
Memorial NeighborhoodEstimated Value: $263,539 - $311,000
4
Beds
3
Baths
2,274
Sq Ft
$124/Sq Ft
Est. Value
About This Home
This home is located at 12949 Trail Hollow Dr Unit 6, Houston, TX 77079 and is currently estimated at $282,135, approximately $124 per square foot. 12949 Trail Hollow Dr Unit 6 is a home located in Harris County with nearby schools including Rummel Creek Elementary School, Memorial Middle, and Stratford High School.
Ownership History
Date
Name
Owned For
Owner Type
Purchase Details
Closed on
Jun 10, 2019
Sold by
Labelle Raymond and Labelle Youngsoon
Bought by
Ahn Sam M and Ahn Linda M
Current Estimated Value
Purchase Details
Closed on
Jan 7, 2013
Sold by
Lee Soung Ae and Oh Myung Soo
Bought by
Labelle Raymond and Labelle Youngsoon
Purchase Details
Closed on
Sep 21, 2006
Sold by
Gensler Quentin G and Gensler Patricia G
Bought by
Kim Jong H and Lee Soung Ae
Home Financials for this Owner
Home Financials are based on the most recent Mortgage that was taken out on this home.
Original Mortgage
$105,750
Interest Rate
6.47%
Mortgage Type
Stand Alone First
Purchase Details
Closed on
Oct 15, 2004
Sold by
Hagstrom & Halstead Llp
Bought by
Gensler Quentin G and Gensler Patricia G
Create a Home Valuation Report for This Property
The Home Valuation Report is an in-depth analysis detailing your home's value as well as a comparison with similar homes in the area
Home Values in the Area
Average Home Value in this Area
Purchase History
| Date | Buyer | Sale Price | Title Company |
|---|---|---|---|
| Ahn Sam M | -- | Fidelity National Title | |
| Labelle Raymond | -- | None Available | |
| Kim Jong H | -- | Ameripoint Title Company | |
| Gensler Quentin G | -- | Ameripoint Title |
Source: Public Records
Mortgage History
| Date | Status | Borrower | Loan Amount |
|---|---|---|---|
| Previous Owner | Kim Jong H | $105,750 |
Source: Public Records
Tax History Compared to Growth
Tax History
| Year | Tax Paid | Tax Assessment Tax Assessment Total Assessment is a certain percentage of the fair market value that is determined by local assessors to be the total taxable value of land and additions on the property. | Land | Improvement |
|---|---|---|---|---|
| 2025 | $5,795 | $221,775 | $42,137 | $179,638 |
| 2024 | $5,795 | $262,891 | $49,949 | $212,942 |
| 2023 | $5,795 | $263,139 | $49,996 | $213,143 |
| 2022 | $6,010 | $257,061 | $52,828 | $204,233 |
| 2021 | $6,292 | $257,708 | $48,965 | $208,743 |
| 2020 | $5,936 | $236,899 | $47,637 | $189,262 |
| 2019 | $6,442 | $246,084 | $48,242 | $197,842 |
| 2018 | $3,120 | $255,000 | $53,467 | $201,533 |
| 2017 | $6,925 | $264,709 | $53,467 | $211,242 |
| 2016 | $6,880 | $263,000 | $53,239 | $209,761 |
| 2015 | $4,179 | $255,000 | $48,450 | $206,550 |
| 2014 | $4,179 | $157,000 | $29,830 | $127,170 |
Source: Public Records
Map
Nearby Homes
- 832 Wax Myrtle Ln Unit 832
- 12973 Trail Hollow Dr Unit A
- 12971 Trail Hollow Dr Unit A
- 13050 Trail Hollow Dr
- 13194 Trail Hollow Dr Unit 3194
- 13060 Trail Hollow Dr Unit 3060
- 12978 Trail Hollow Dr Unit 2978
- 12984 Trail Hollow Dr Unit 2984
- 13074 Trail Hollow Dr Unit 3074
- 13228 Trail Hollow Dr Unit 3228
- 13282 Trail Hollow Dr Unit 3282
- 893 Wax Myrtle Ln Unit 3
- 839 Wax Myrtle Ln
- 13346 Trail Hollow Dr Unit 3346
- 841 Wax Myrtle Ln Unit A
- 903 Wax Myrtle Ln
- 706 Wax Myrtle Ln
- 859 Wax Myrtle Ln
- 861 Wax Myrtle Ln
- 921 Wax Myrtle Ln
- 12949 Trail Hollow Dr Unit 2949
- 12949 Trail Hollow Dr Unit 12949
- 12949 Trail Hollow Dr Unit 12949
- 12951 Trail Hollow Dr Unit 2951
- 12947 Trail Hollow Dr Unit 2947
- 12941 Trail Hollow Dr Unit 2941
- 12953 Trail Hollow Dr Unit 2953
- 12945 Trail Hollow Dr Unit 2945
- 12943 Trail Hollow Dr Unit 2943
- 12943 Trail Hollow Dr Unit 3
- 12965 Trail Hollow Dr Unit 2965
- 12939 Trail Hollow Dr Unit 2939
- 12963 Trail Hollow Dr Unit 2963
- 12909 Trail Hollow Dr Unit 2909
- 12961 Trail Hollow Dr Unit 2961
- 12971A Trail Hollow Dr Unit 7
- 12997 Trail Hollow Dr Unit 2997
- 12903 Trail Hollow Dr Unit 2903
- 12911 Trail Hollow Dr Unit 2911
- 12995 Trail Hollow Dr Unit 2995