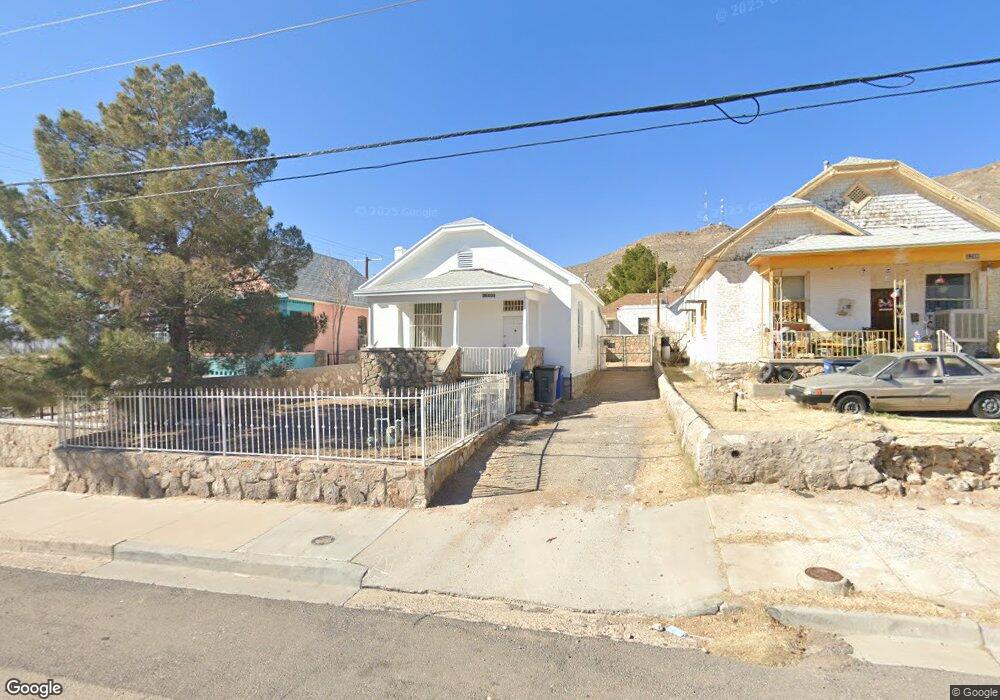
1295 Dakota St El Paso, TX 79930
Highland Park NeighborhoodEstimated Value: $144,000 - $195,000
--
Bed
1
Bath
1,150
Sq Ft
$148/Sq Ft
Est. Value
About This Home
This home is located at 1295 Dakota St, El Paso, TX 79930 and is currently estimated at $170,085, approximately $147 per square foot. 1295 Dakota St is a home located in El Paso County with nearby schools including Moreno Elementary School, Armendariz Middle School, and Middle School-5 NW Middle.
Ownership History
Date
Name
Owned For
Owner Type
Purchase Details
Closed on
Jun 18, 2025
Sold by
Resendez Natalie and Resendez Daniel
Bought by
Resendez Natalie and Resendez Daniel
Current Estimated Value
Home Financials for this Owner
Home Financials are based on the most recent Mortgage that was taken out on this home.
Original Mortgage
$100,100
Outstanding Balance
$99,846
Interest Rate
6.86%
Mortgage Type
New Conventional
Estimated Equity
$70,239
Purchase Details
Closed on
Feb 13, 1998
Sold by
Action Capital Investments Inc
Bought by
Rosson Michael
Home Financials for this Owner
Home Financials are based on the most recent Mortgage that was taken out on this home.
Original Mortgage
$50,000
Interest Rate
7.12%
Mortgage Type
Seller Take Back
Purchase Details
Closed on
Jan 9, 1997
Sold by
Mazziotta Vincent
Bought by
Action Capital Investments Inc
Purchase Details
Closed on
Jul 18, 1996
Sold by
Simpson Ofelia
Bought by
Mazziotta Vince
Create a Home Valuation Report for This Property
The Home Valuation Report is an in-depth analysis detailing your home's value as well as a comparison with similar homes in the area
Home Values in the Area
Average Home Value in this Area
Purchase History
| Date | Buyer | Sale Price | Title Company |
|---|---|---|---|
| Resendez Natalie | -- | None Listed On Document | |
| Rosson Michael | -- | Commonwealth Land Title Co | |
| Action Capital Investments Inc | -- | Commonwealth Land Title Co | |
| Action Capital Investments Inc | -- | -- | |
| Mazziotta Vince | -- | -- |
Source: Public Records
Mortgage History
| Date | Status | Borrower | Loan Amount |
|---|---|---|---|
| Open | Resendez Natalie | $100,100 | |
| Previous Owner | Rosson Michael | $50,000 |
Source: Public Records
Tax History Compared to Growth
Tax History
| Year | Tax Paid | Tax Assessment Tax Assessment Total Assessment is a certain percentage of the fair market value that is determined by local assessors to be the total taxable value of land and additions on the property. | Land | Improvement |
|---|---|---|---|---|
| 2025 | $3,325 | $147,300 | $20,760 | $126,540 |
| 2024 | $3,325 | $128,093 | $20,760 | $107,333 |
| 2023 | $3,325 | $109,403 | $15,252 | $94,151 |
| 2022 | $3,037 | $102,594 | $15,252 | $87,342 |
| 2021 | $2,686 | $74,000 | $15,252 | $58,748 |
| 2020 | $2,554 | $83,100 | $12,202 | $70,898 |
| 2018 | $2,248 | $75,963 | $12,202 | $63,761 |
| 2017 | $2,087 | $74,102 | $12,202 | $61,900 |
| 2016 | $2,218 | $78,761 | $12,202 | $66,559 |
| 2015 | $2,188 | $78,761 | $12,202 | $66,559 |
| 2014 | $2,188 | $79,946 | $12,202 | $67,744 |
Source: Public Records
Map
Nearby Homes
- 2309 San Diego Ave
- 2415 Pittsburg Ave
- 2520 San Jose Ave Unit 4C
- 2520 San Jose Ave Unit 4D
- 1605 Dakota St
- 2212 Silver Ave
- 2612 San Jose Ave
- 2413 Copper Ave
- 2510 Federal Ave
- 2805 Grant Ave
- 1229 Ohio St
- 2012 San Jose Ave
- 1813 & 181 Alabama St
- 2630 Wheeling Ave
- 1701 Elm St
- 2406 Lebanon Ave
- 2624 Aurora Ave
- 1712 Elm St
- 2407 Grant Ave
- 2735 Aurora Ave
- 1291 Dakota St
- 1299 Dakota St
- 2318 San Jose Ave
- 2325 Portland Ave
- 1285 Dakota St
- 2323 Portland Ave
- 2400 San Jose Ave
- 1290 Dakota St
- 2316 San Jose Ave
- 2317 Portland Ave
- 2406 San Jose Ave
- 2401 Portland Ave Unit A
- 2401 Portland Ave
- 2315 Portland Ave
- 2401 San Jose Ave
- 2405 Portland Ave
- 2408 San Jose Ave
- 2311 Portland Ave
- 2304 San Jose Ave
- 1306 Dakota St