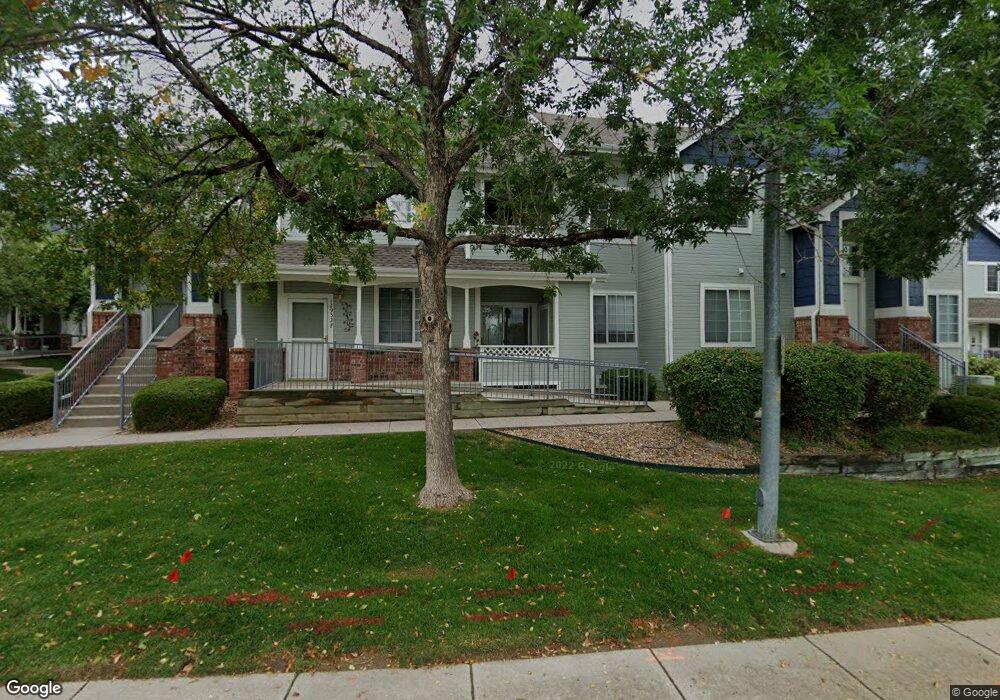
12953 Lafayette St Unit F Thornton, CO 80241
Hunters Glen NeighborhoodEstimated Value: $334,696 - $353,000
2
Beds
2
Baths
1,085
Sq Ft
$320/Sq Ft
Est. Value
About This Home
This home is located at 12953 Lafayette St Unit F, Thornton, CO 80241 and is currently estimated at $346,674, approximately $319 per square foot. 12953 Lafayette St Unit F is a home located in Adams County with nearby schools including Hunters Glen Elementary School, Century Middle School, and Mountain Range High School.
Ownership History
Date
Name
Owned For
Owner Type
Purchase Details
Closed on
May 14, 2004
Sold by
Nichols Debra D
Bought by
Nichols Debra D
Current Estimated Value
Purchase Details
Closed on
Sep 24, 2003
Sold by
Nichols Debra D
Bought by
Manis Darrel D
Home Financials for this Owner
Home Financials are based on the most recent Mortgage that was taken out on this home.
Original Mortgage
$93,000
Outstanding Balance
$43,083
Interest Rate
6.22%
Mortgage Type
Unknown
Estimated Equity
$303,591
Purchase Details
Closed on
Nov 19, 2001
Sold by
Manis Darrel D
Bought by
Manis Darrel D and Nichols Debra D
Purchase Details
Closed on
Jun 25, 1998
Sold by
D R Horton Inc Denver
Bought by
Manis Darrel D
Home Financials for this Owner
Home Financials are based on the most recent Mortgage that was taken out on this home.
Original Mortgage
$94,200
Interest Rate
7.08%
Mortgage Type
FHA
Create a Home Valuation Report for This Property
The Home Valuation Report is an in-depth analysis detailing your home's value as well as a comparison with similar homes in the area
Home Values in the Area
Average Home Value in this Area
Purchase History
| Date | Buyer | Sale Price | Title Company |
|---|---|---|---|
| Nichols Debra D | -- | -- | |
| Manis Darrel D | -- | Land Title Guarantee Company | |
| Manis Darrel D | -- | -- | |
| Manis Darrel D | $97,110 | -- |
Source: Public Records
Mortgage History
| Date | Status | Borrower | Loan Amount |
|---|---|---|---|
| Open | Manis Darrel D | $93,000 | |
| Previous Owner | Manis Darrel D | $94,200 |
Source: Public Records
Tax History Compared to Growth
Tax History
| Year | Tax Paid | Tax Assessment Tax Assessment Total Assessment is a certain percentage of the fair market value that is determined by local assessors to be the total taxable value of land and additions on the property. | Land | Improvement |
|---|---|---|---|---|
| 2024 | $2,079 | $22,070 | $4,690 | $17,380 |
| 2023 | $2,058 | $23,820 | $4,400 | $19,420 |
| 2022 | $2,186 | $19,200 | $3,680 | $15,520 |
| 2021 | $2,186 | $19,200 | $3,680 | $15,520 |
| 2020 | $2,143 | $19,210 | $3,790 | $15,420 |
| 2019 | $2,147 | $19,210 | $3,790 | $15,420 |
| 2018 | $1,870 | $16,250 | $950 | $15,300 |
| 2017 | $1,700 | $16,250 | $950 | $15,300 |
| 2016 | $1,287 | $11,980 | $1,050 | $10,930 |
| 2015 | $1,286 | $11,980 | $1,050 | $10,930 |
| 2014 | $1,004 | $8,700 | $1,050 | $7,650 |
Source: Public Records
Map
Nearby Homes
- 1162 E 130th Ave Unit B
- 12931 Lafayette St Unit G
- 12905 Lafayette St Unit H
- 1124 E 130th Ave Unit C
- 13309 Franklin St
- 1089 E 131st Dr
- 978 E 132nd Dr
- 12829 Claude Place
- 13398 Race St
- 634 E 130th Way
- 2279 E 129th Ave
- 2275 E 129th Ave
- 13485 Marion St
- 13283 Clarkson St
- 0 128th & Washington St
- 12811 Josephine Ct
- 1282 E 135th Place
- 13560 High Cir
- 2420 E 127th Ave
- 12962 Grant Cir E Unit C
- 12953 Lafayette St Unit H
- 12953 Lafayette St Unit G
- 12953 Lafayette St Unit E
- 12953 Lafayette St Unit D
- 12953 Lafayette St Unit B
- 12953 Lafayette St Unit A
- 12953 Lafayette St
- 12955 Lafayette St Unit H
- 12955 Lafayette St Unit G
- 12955 Lafayette St Unit F
- 12955 Lafayette St Unit E
- 12955 Lafayette St Unit D
- 12955 Lafayette St Unit B
- 12955 Lafayette St Unit A
- 12955 Lafayette St Unit CD
- 12951 Lafayette St Unit H
- 12951 Lafayette St Unit G
- 12951 Lafayette St Unit F
- 12951 Lafayette St Unit E
- 12951 Lafayette St Unit D