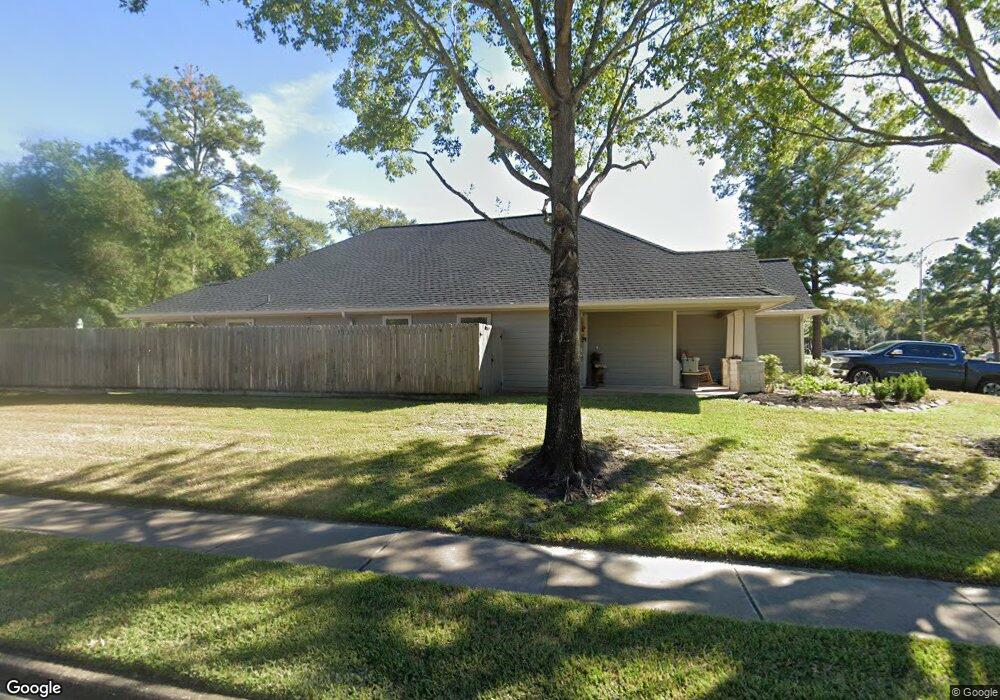
12954 Yorkmont Dr Cypress, TX 77429
Estimated Value: $342,729 - $372,000
3
Beds
2
Baths
2,079
Sq Ft
$173/Sq Ft
Est. Value
About This Home
This home is located at 12954 Yorkmont Dr, Cypress, TX 77429 and is currently estimated at $360,432, approximately $173 per square foot. 12954 Yorkmont Dr is a home located in Harris County with nearby schools including Sampson Elementary School, Spillane Middle School, and Cypress Woods High School.
Ownership History
Date
Name
Owned For
Owner Type
Purchase Details
Closed on
Aug 25, 2014
Sold by
Erkens Susan D
Bought by
Brien Christopher S O and Brien Susan D O
Current Estimated Value
Home Financials for this Owner
Home Financials are based on the most recent Mortgage that was taken out on this home.
Original Mortgage
$140,000
Outstanding Balance
$45,351
Interest Rate
4.17%
Mortgage Type
Stand Alone First
Estimated Equity
$315,081
Purchase Details
Closed on
Jan 10, 2003
Sold by
Newmark Homes Lp
Bought by
Erkens Susan D
Home Financials for this Owner
Home Financials are based on the most recent Mortgage that was taken out on this home.
Original Mortgage
$117,580
Interest Rate
6.16%
Mortgage Type
FHA
Create a Home Valuation Report for This Property
The Home Valuation Report is an in-depth analysis detailing your home's value as well as a comparison with similar homes in the area
Home Values in the Area
Average Home Value in this Area
Purchase History
| Date | Buyer | Sale Price | Title Company |
|---|---|---|---|
| Brien Christopher S O | -- | None Available | |
| Brien Christopher S O | -- | Entitle Insurance Co | |
| Erkens Susan D | -- | Universal Land Title |
Source: Public Records
Mortgage History
| Date | Status | Borrower | Loan Amount |
|---|---|---|---|
| Open | Brien Christopher S O | $140,000 | |
| Closed | Brien Christopher S O | $140,000 | |
| Previous Owner | Erkens Susan D | $117,580 |
Source: Public Records
Tax History Compared to Growth
Tax History
| Year | Tax Paid | Tax Assessment Tax Assessment Total Assessment is a certain percentage of the fair market value that is determined by local assessors to be the total taxable value of land and additions on the property. | Land | Improvement |
|---|---|---|---|---|
| 2025 | $5,117 | $353,055 | $65,410 | $287,645 |
| 2024 | $5,117 | $353,055 | $65,410 | $287,645 |
| 2023 | $5,117 | $353,251 | $65,410 | $287,841 |
| 2022 | $6,681 | $317,934 | $48,452 | $269,482 |
| 2021 | $6,451 | $254,876 | $48,452 | $206,424 |
| 2020 | $6,155 | $235,873 | $38,762 | $197,111 |
| 2019 | $6,204 | $230,573 | $38,762 | $191,811 |
| 2018 | $2,296 | $230,573 | $38,762 | $191,811 |
| 2017 | $6,205 | $230,573 | $38,762 | $191,811 |
| 2016 | $6,169 | $230,573 | $38,762 | $191,811 |
| 2015 | $4,156 | $218,665 | $38,762 | $179,903 |
| 2014 | $4,156 | $199,561 | $38,762 | $160,799 |
Source: Public Records
Map
Nearby Homes
- 13014 Vivienne Westmoreland Dr
- 15803 Stiller Park Dr
- 13718 Sherburn Manor Dr
- 14210 Prospect Point Dr
- 13611 Monteigne Ln
- 14314 Prosper Ridge Dr
- 14103 Sherburn Manor Dr
- 16306 Bontura St
- 15923 Hurstfield Pointe Dr
- 16219 Haden Crest Ct
- 16322 Bontura St
- 13402 Layton Castle Ln
- 12603 Telge Rd Unit 30C-D
- 12603 Telge Rd Unit 26 E-F
- 12603 Telge Rd Unit 8 I-L
- 12803 Shady Knoll Ln
- 12719 Shady Knoll Ln
- 13703 Layton Hills Dr
- 13835 Jarvis Rd
- 12726 Shady Knoll Ln
- 12950 Yorkmont Dr
- 12946 Yorkmont Dr
- 13002 Yorkmont Dr
- 12942 Yorkmont Dr
- 12951 Yorkmont Dr
- 12947 Yorkmont Dr
- 13006 Yorkmont Dr
- 12938 Yorkmont Dr
- 12943 Yorkmont Dr
- 13003 Yorkmont Dr
- 13010 Yorkmont Dr
- 12939 Yorkmont Dr
- 12934 Yorkmont Dr
- 13007 Yorkmont Dr
- 12951 Bedford Falls Dr
- 12947 Bedford Falls Dr
- 12922 Norstrum Falls Ct
- 12935 Yorkmont Dr
- 13014 Yorkmont Dr
- 13011 Yorkmont Dr