Estimated Value: $322,000 - $497,921
3
Beds
2
Baths
1,512
Sq Ft
$276/Sq Ft
Est. Value
About This Home
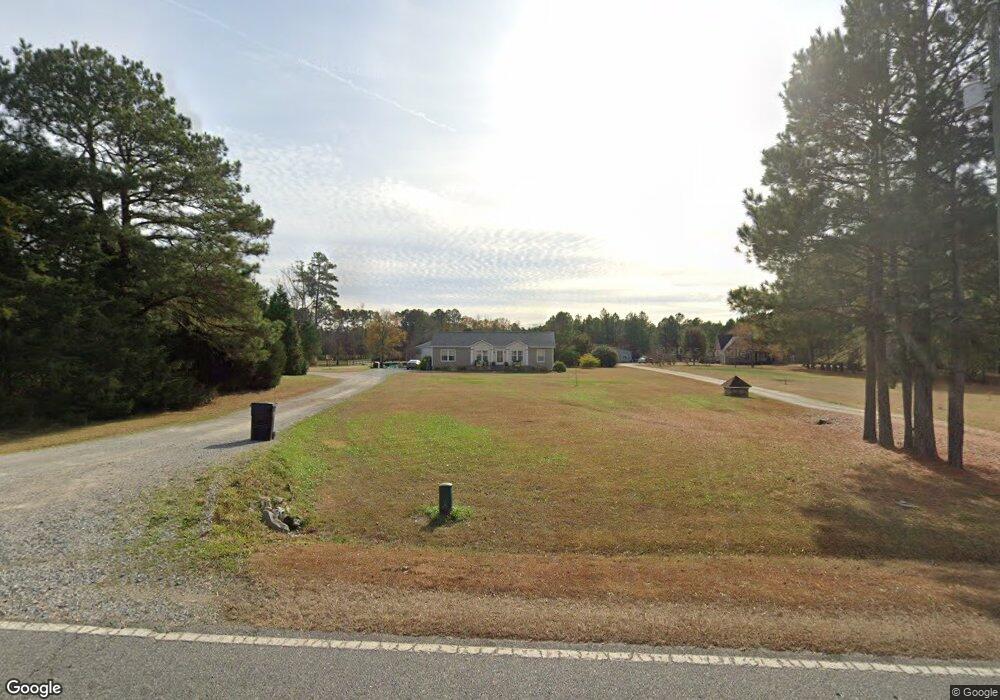
This home is located at 1296 Branch Chapel Church Rd, Selma, NC 27576 and is currently estimated at $416,730, approximately $275 per square foot. 1296 Branch Chapel Church Rd is a home located in Johnston County with nearby schools including Archer Lodge Middle School and Corinth Holders High School.
Ownership History
Date
Name
Owned For
Owner Type
Purchase Details
Closed on
Feb 27, 2016
Sold by
Creech Pamela Marie and Creech Steven
Bought by
Durham Ryan Grey
Current Estimated Value
Purchase Details
Closed on
Jun 8, 2006
Sold by
Cmh Homes Inc
Bought by
Durham Ryan G and Durham Pamela B
Home Financials for this Owner
Home Financials are based on the most recent Mortgage that was taken out on this home.
Original Mortgage
$134,650
Interest Rate
6.49%
Mortgage Type
Purchase Money Mortgage
Purchase Details
Closed on
Mar 15, 2006
Sold by
Kersey Jennifer
Bought by
Cmh Homes Inc and Oakwood Homes
Purchase Details
Closed on
Nov 14, 2005
Sold by
Kersey Jennifer
Bought by
Webster Ryan and Webster Kimberly
Purchase Details
Closed on
Nov 2, 2005
Sold by
Kersey Jeanifer
Bought by
Whitley Lara Nieole Loucks and Whitley Joseph Gregory
Create a Home Valuation Report for This Property
The Home Valuation Report is an in-depth analysis detailing your home's value as well as a comparison with similar homes in the area
Home Values in the Area
Average Home Value in this Area
Purchase History
| Date | Buyer | Sale Price | Title Company |
|---|---|---|---|
| Durham Ryan Grey | -- | None Available | |
| Durham Ryan G | $142,000 | None Available | |
| Cmh Homes Inc | $50,000 | None Available | |
| Webster Ryan | $63,000 | None Available | |
| Whitley Lara Nieole Loucks | $75,000 | None Available |
Source: Public Records
Mortgage History
| Date | Status | Borrower | Loan Amount |
|---|---|---|---|
| Previous Owner | Durham Ryan G | $134,650 |
Source: Public Records
Tax History Compared to Growth
Tax History
| Year | Tax Paid | Tax Assessment Tax Assessment Total Assessment is a certain percentage of the fair market value that is determined by local assessors to be the total taxable value of land and additions on the property. | Land | Improvement |
|---|---|---|---|---|
| 2025 | $3,273 | $515,430 | $242,120 | $273,310 |
| 2024 | $2,128 | $262,740 | $85,190 | $177,550 |
| 2023 | $2,076 | $262,740 | $85,190 | $177,550 |
| 2022 | $2,128 | $262,740 | $85,190 | $177,550 |
| 2021 | $2,128 | $262,740 | $85,190 | $177,550 |
| 2020 | $2,225 | $262,740 | $85,190 | $177,550 |
| 2019 | $2,232 | $262,740 | $85,190 | $177,550 |
| 2018 | $1,523 | $177,130 | $53,600 | $123,530 |
| 2017 | $1,523 | $177,130 | $53,600 | $123,530 |
| 2016 | $1,523 | $177,130 | $53,600 | $123,530 |
| 2015 | $1,559 | $177,130 | $53,600 | $123,530 |
| 2014 | $1,559 | $177,130 | $53,600 | $123,530 |
Source: Public Records
Map
Nearby Homes
- 1316 Branch Chapel Church Rd
- 0 Branch Chapel Church Rd Unit TR1750029
- 1200 Branch Chapel Church Rd
- 1211 Branch Chapel Church Rd
- 1443 Branch Chapel Church Rd
- 1117 Branch Chapel Church Rd
- 1100+ Branch Chapel Church Rd
- 1100 Branch Chapel Church Rd Unit A
- 1100 Branch Chapel Church Rd
- 1526 Branch Chapel Church Rd
- 1020 Branch Chapel Church Rd
- 1020 Branch Chapel Church Rd Unit none
- 1105 Branch Chapel Church Rd
- 1083 Branch Chapel Church Rd
- 1539 Branch Chapel Church Rd
- 1600 Branch Chapel Church Rd
- 1061 Branch Chapel Church Rd
- 1017 Branch Chapel Church Rd
- 950 Branch Chapel Church Rd
- 1161 Dunn Rd