Estimated Value: $123,000 - $196,000
2
Beds
1
Bath
920
Sq Ft
$187/Sq Ft
Est. Value
About This Home
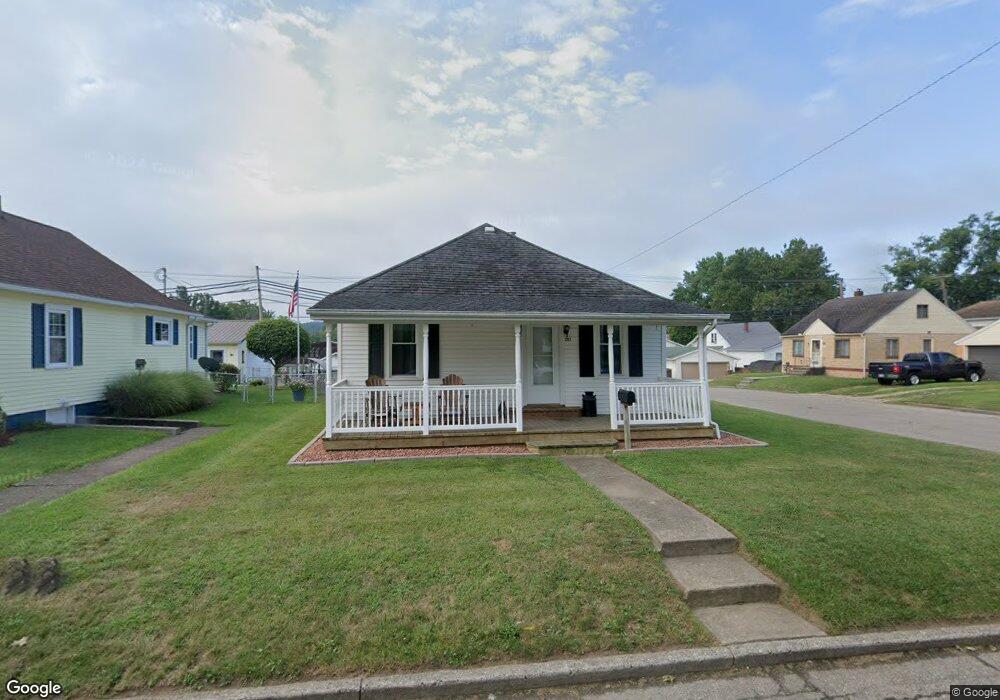
This home is located at 1297 3rd St, Logan, OH 43138 and is currently estimated at $171,650, approximately $186 per square foot. 1297 3rd St is a home located in Hocking County with nearby schools including Chieftain Elementary School, St. John the Evangelist School, and Logan Christian School.
Ownership History
Date
Name
Owned For
Owner Type
Purchase Details
Closed on
Jan 6, 2022
Sold by
Mcdaniel Bethany M
Bought by
Vecchiarelli Dalton Nicholas
Current Estimated Value
Home Financials for this Owner
Home Financials are based on the most recent Mortgage that was taken out on this home.
Original Mortgage
$152,000
Outstanding Balance
$139,800
Interest Rate
3.11%
Mortgage Type
New Conventional
Estimated Equity
$31,850
Purchase Details
Closed on
Apr 8, 2014
Sold by
Mcdaniel Sara
Bought by
Mcdaniel Bethany M
Home Financials for this Owner
Home Financials are based on the most recent Mortgage that was taken out on this home.
Original Mortgage
$55,500
Interest Rate
4.41%
Mortgage Type
Future Advance Clause Open End Mortgage
Purchase Details
Closed on
Sep 14, 2004
Bought by
Mcdaniel Bethany Et.Al. 1297 Third St
Create a Home Valuation Report for This Property
The Home Valuation Report is an in-depth analysis detailing your home's value as well as a comparison with similar homes in the area
Home Values in the Area
Average Home Value in this Area
Purchase History
| Date | Buyer | Sale Price | Title Company |
|---|---|---|---|
| Vecchiarelli Dalton Nicholas | -- | Plank Rhett A | |
| Mcdaniel Bethany M | $44,000 | None Available | |
| Mcdaniel Bethany M | -- | None Available | |
| Mcdaniel Bethany Et.Al. 1297 Third St | $44,000 | -- |
Source: Public Records
Mortgage History
| Date | Status | Borrower | Loan Amount |
|---|---|---|---|
| Open | Vecchiarelli Dalton Nicholas | $152,000 | |
| Previous Owner | Mcdaniel Bethany M | $55,500 |
Source: Public Records
Tax History
| Year | Tax Paid | Tax Assessment Tax Assessment Total Assessment is a certain percentage of the fair market value that is determined by local assessors to be the total taxable value of land and additions on the property. | Land | Improvement |
|---|---|---|---|---|
| 2024 | $1,569 | $31,190 | $5,650 | $25,540 |
| 2023 | $1,232 | $31,190 | $5,650 | $25,540 |
| 2022 | $1,234 | $31,190 | $5,650 | $25,540 |
| 2021 | $1,141 | $26,720 | $3,940 | $22,780 |
| 2020 | $1,141 | $26,720 | $3,940 | $22,780 |
| 2019 | $1,142 | $26,720 | $3,940 | $22,780 |
| 2018 | $1,053 | $25,070 | $3,430 | $21,640 |
| 2017 | $991 | $25,070 | $3,430 | $21,640 |
| 2016 | $984 | $25,070 | $3,430 | $21,640 |
| 2015 | $987 | $24,210 | $4,290 | $19,920 |
| 2014 | $987 | $24,210 | $4,290 | $19,920 |
| 2013 | $991 | $24,210 | $4,290 | $19,920 |
Source: Public Records
Map
Nearby Homes
Your Personal Tour Guide
Ask me questions while you tour the home.