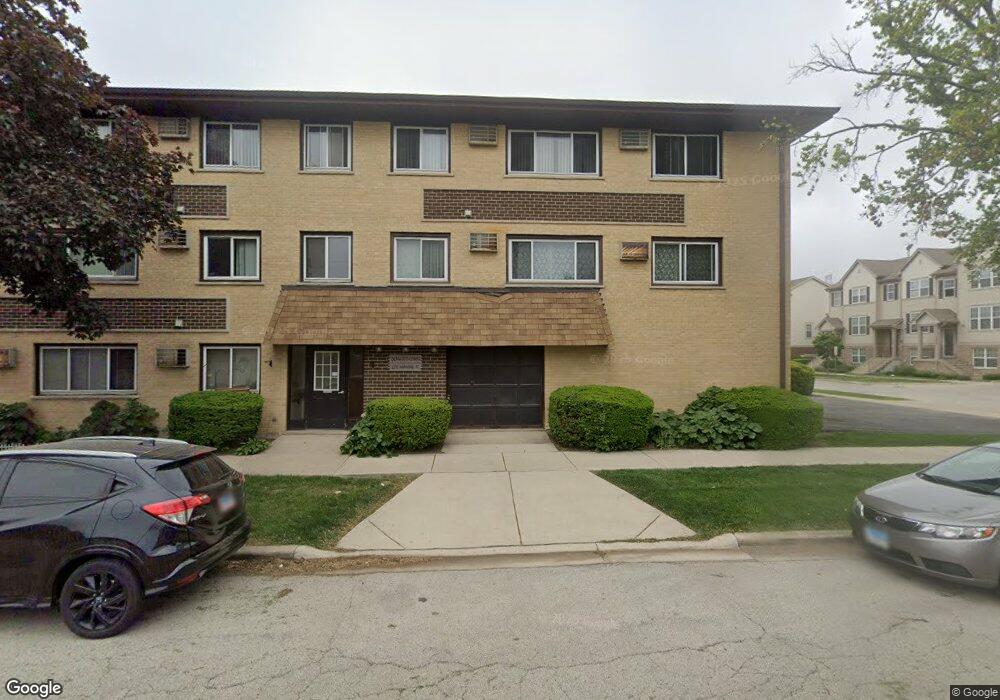
1297 Harding Ave Unit 3C Des Plaines, IL 60016
Estimated Value: $149,413 - $431,000
1
Bed
--
Bath
10,671
Sq Ft
$21/Sq Ft
Est. Value
About This Home
This home is located at 1297 Harding Ave Unit 3C, Des Plaines, IL 60016 and is currently estimated at $222,603, approximately $20 per square foot. 1297 Harding Ave Unit 3C is a home located in Cook County with nearby schools including North Elementary School, Chippewa Middle School, and Maine West High School.
Ownership History
Date
Name
Owned For
Owner Type
Purchase Details
Closed on
Feb 8, 2012
Sold by
Wisniowski Ryszard and Wisniowski Barbara
Bought by
Wisniowski Marek
Current Estimated Value
Purchase Details
Closed on
Feb 20, 2003
Sold by
Traczykowska Marzena and Wisniowski Marek
Bought by
Wisniowski Marek and Wisniowski Ryszard
Home Financials for this Owner
Home Financials are based on the most recent Mortgage that was taken out on this home.
Original Mortgage
$86,000
Outstanding Balance
$36,966
Interest Rate
6%
Estimated Equity
$185,637
Purchase Details
Closed on
Aug 22, 2000
Sold by
Denzinger Norman and Denzinger Catherine
Bought by
Wisniowski Marek and Traczykowska Marzena
Home Financials for this Owner
Home Financials are based on the most recent Mortgage that was taken out on this home.
Original Mortgage
$66,975
Interest Rate
8.3%
Create a Home Valuation Report for This Property
The Home Valuation Report is an in-depth analysis detailing your home's value as well as a comparison with similar homes in the area
Home Values in the Area
Average Home Value in this Area
Purchase History
| Date | Buyer | Sale Price | Title Company |
|---|---|---|---|
| Wisniowski Marek | -- | Citywide Title Corporation | |
| Wisniowski Marek | -- | Multiple | |
| Wisniowski Marek | $70,500 | -- |
Source: Public Records
Mortgage History
| Date | Status | Borrower | Loan Amount |
|---|---|---|---|
| Open | Wisniowski Marek | $86,000 | |
| Closed | Wisniowski Marek | $66,975 |
Source: Public Records
Tax History Compared to Growth
Tax History
| Year | Tax Paid | Tax Assessment Tax Assessment Total Assessment is a certain percentage of the fair market value that is determined by local assessors to be the total taxable value of land and additions on the property. | Land | Improvement |
|---|---|---|---|---|
| 2024 | $1,770 | $10,030 | $582 | $9,448 |
| 2023 | $1,700 | $10,030 | $582 | $9,448 |
| 2022 | $1,700 | $10,030 | $582 | $9,448 |
| 2021 | $720 | $5,672 | $472 | $5,200 |
| 2020 | $777 | $5,672 | $472 | $5,200 |
| 2019 | $778 | $6,321 | $472 | $5,849 |
| 2018 | $539 | $5,238 | $417 | $4,821 |
| 2017 | $547 | $5,238 | $417 | $4,821 |
| 2016 | $762 | $5,238 | $417 | $4,821 |
| 2015 | $1,168 | $6,486 | $363 | $6,123 |
| 2014 | $1,159 | $6,486 | $363 | $6,123 |
| 2013 | $1,113 | $6,486 | $363 | $6,123 |
Source: Public Records
Map
Nearby Homes
- 1279 Harding Ave Unit 3B
- 1279 Harding Ave Unit 2B
- 1245 Evergreen Ave
- 1258 Brown St Unit 302
- 1363 Brown St Unit 3C
- 395 Graceland Ave Unit 207
- 394 Alles St Unit 3B
- 1363 Perry St Unit 1B
- 1433 Willow Ave
- 1108 Evergreen Ave
- 1389 Perry St Unit 303
- 476 Alles St Unit 210
- 430 Oak St
- 555 Graceland Ave Unit 206
- 501 Alles St Unit 501A
- 431 Oak St
- 550 Ida St Unit 2NW
- 1057 Hollywood Ave
- 1470 Jefferson St Unit 405
- 184 Lilah Ct
- 1297 Harding Ave Unit 3A
- 1297 Harding Ave Unit 2B
- 1297 Harding Ave Unit 2A
- 1297 Harding Ave Unit 2D
- 1297 Harding Ave Unit 2C
- 1297 Harding Ave Unit 1B
- 1297 Harding Ave Unit 1A
- 1297 Harding Ave Unit 3D
- 1297 Harding Ave Unit 3B
- 1289 Harding Ave
- 1279 Harding Ave Unit 1A
- 1279 Harding Ave Unit 3D
- 1279 Harding Ave Unit 2D
- 1279 Harding Ave Unit 3C
- 1279 Harding Ave Unit 3A
- 1279 Harding Ave Unit 2C
- 1279 Harding Ave Unit 2A
- 1279 Harding Ave Unit 3E
- 1279 Harding Ave Unit 2E
- 1279 Harding Ave Unit 1B