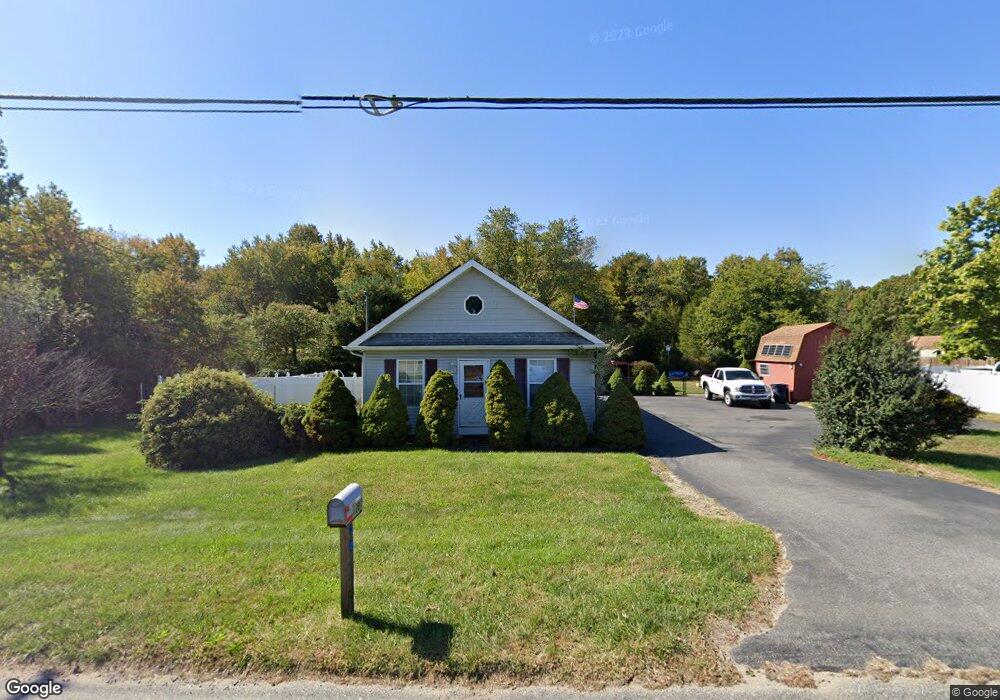
1297 N Tuckahoe Rd Williamstown, NJ 08094
Monroe Township Gloucester NeighborhoodEstimated Value: $213,000 - $264,000
--
Bed
--
Bath
976
Sq Ft
$243/Sq Ft
Est. Value
About This Home
This home is located at 1297 N Tuckahoe Rd, Williamstown, NJ 08094 and is currently estimated at $237,360, approximately $243 per square foot. 1297 N Tuckahoe Rd is a home located in Gloucester County with nearby schools including Williamstown High School, St. Mary School, and Beacon Academy.
Ownership History
Date
Name
Owned For
Owner Type
Purchase Details
Closed on
Nov 4, 2003
Sold by
Pazulski Pelagie C
Bought by
Sargalski Mark
Current Estimated Value
Purchase Details
Closed on
Nov 2, 2000
Sold by
Hud
Bought by
Sargalski Mark and Pazulski Pelagie C
Home Financials for this Owner
Home Financials are based on the most recent Mortgage that was taken out on this home.
Original Mortgage
$52,162
Interest Rate
8.25%
Purchase Details
Closed on
Aug 25, 2000
Sold by
Wilson Frederick and Wilson Stephanie
Bought by
Hud
Purchase Details
Closed on
Aug 24, 1998
Sold by
Prychka John P and Prychka Wendy L
Bought by
Wilson Frederick and Wilson Stephanie
Home Financials for this Owner
Home Financials are based on the most recent Mortgage that was taken out on this home.
Original Mortgage
$71,268
Interest Rate
6.86%
Create a Home Valuation Report for This Property
The Home Valuation Report is an in-depth analysis detailing your home's value as well as a comparison with similar homes in the area
Home Values in the Area
Average Home Value in this Area
Purchase History
| Date | Buyer | Sale Price | Title Company |
|---|---|---|---|
| Sargalski Mark | -- | -- | |
| Sargalski Mark | $52,162 | Fidelity National Title Ins | |
| Hud | -- | -- | |
| Wilson Frederick | $69,900 | Congress Title Corp |
Source: Public Records
Mortgage History
| Date | Status | Borrower | Loan Amount |
|---|---|---|---|
| Previous Owner | Sargalski Mark | $52,162 | |
| Previous Owner | Wilson Frederick | $71,268 |
Source: Public Records
Tax History Compared to Growth
Tax History
| Year | Tax Paid | Tax Assessment Tax Assessment Total Assessment is a certain percentage of the fair market value that is determined by local assessors to be the total taxable value of land and additions on the property. | Land | Improvement |
|---|---|---|---|---|
| 2025 | $3,787 | $103,400 | $43,000 | $60,400 |
| 2024 | $3,759 | $103,400 | $43,000 | $60,400 |
| 2023 | $3,759 | $103,400 | $43,000 | $60,400 |
| 2022 | $3,741 | $103,400 | $43,000 | $60,400 |
| 2021 | $3,738 | $103,400 | $43,000 | $60,400 |
| 2020 | $3,761 | $103,400 | $43,000 | $60,400 |
| 2019 | $3,738 | $103,400 | $43,000 | $60,400 |
| 2018 | $3,677 | $103,400 | $43,000 | $60,400 |
| 2017 | $4,038 | $114,000 | $48,200 | $65,800 |
| 2016 | $3,987 | $114,000 | $48,200 | $65,800 |
| 2015 | $3,873 | $114,000 | $48,200 | $65,800 |
| 2014 | $3,760 | $114,000 | $48,200 | $65,800 |
Source: Public Records
Map
Nearby Homes
- 58 Burr St
- 32 Burr St
- 317 Comfort Rd
- 1309 Galloway Ct
- 161 Riley St
- 1311 N Main St
- 1488 N Tuckahoe Rd
- 23 Grandview Ave
- The Derby Plan at Grandview Mews at Monroe
- The Ascot Plan at Grandview Mews at Monroe
- 1 Birchwood Ln
- 1186 Glen Haven Ct
- 9 Birchwood Ln
- 1540 N Tuckahoe Rd
- 24 W Lois Dr
- 128 Kerry Lynn Ct
- 209 Harrison Ave
- 743 Lois Dr
- 1420 N Black Horse Pk Pike
- 1580 N Black Horse Park
- 1281 N Tuckahoe Rd
- 522 Kirkwall Dr
- 1313 N Tuckahoe Rd
- 518 Kirkwall Dr
- 441 Glasgow Rd
- 514 Kirkwall Dr
- 437 Glasgow Rd
- 1261 N Tuckahoe Rd
- 510 Kirkwall Dr
- 433 Glasgow Rd
- 1289 N Tuckahoe Rd
- 430 Glasgow Rd
- 1251 N Tuckahoe Rd
- 426 Glasgow Rd
- 1339 N Tuckahoe Rd
- 506 Kirkwall Dr
- 1000 Fawn Dr
- 429 Glasgow Rd
- 422 Glasgow Rd
- 502 Kirkwall Dr